Net Revenue Retention tells a compelling story
A growth metric that investors, business leaders, and customer success teams emphatically agree on is the Net Revenue Retention (NRR).
NRR, similar to Net Dollar Retention (NDR), makes a non-linear contribution to the growth of a business. And is a straightforward determiner of whether the business is a growth business. Or not.
Public companies report on NRR (or its variation) as it shows actual growth period-over-period. More about actual growth shortly, but the underlying components that make up NRR are essential to track, manage, and gain insights into the company's retention and growth performance.
It is important to note that NRR and NDR are not GAAP-compliant accounting revenue metrics. Therefore, differences in how businesses calculate them are common and expected. We will delve into the definitions, details, and differences shortly. Luckily SEC requires companies to define the metrics in financial reports.
NDR, NRR, and several variations also solve problems associated with metrics based on customer lifetime value, customer acquisition costs, and churn.
Businesses need a simple metric to show period-over-period progress and align employees and investors to drive growth goals.
Businesses need a metric that tells a story.
NDR tells a compelling and accurate story that aligns employees, investors, and the board towards a measurable, explainable, and trackable goal.
Why NRR?
Before we look at NRR or the components that make up NRR, let us digress and look at the customer profitability or business viability ratio, LTV:CAC, and the shortcomings that make LTV:CAC ratio unsuitable for B2B SaaS companies or businesses with recurring revenue in general.
There are several reasons, but let us look at a selection.
- CAC continues to grow: The cost of acquiring customers have increased by over 60% in the last five years for enterprise products - Profitwell
- CAC vs. CRC: For SaaS businesses, the cost of acquiring new customers — and resurrecting lost customers — is 6.4 times the cost of retaining and upselling to existing customers - Bain Research.
- Willingness to pay continues to drop: Customer willingness to pay for features has dropped by over 30% - Profitwell
- Lower switching costs imply shorter customer lifetimes: With increased competition and easier to use and adopt products, the time, money, effort, and emotional cost associated with switching usage from one product to another continues to drop.
- Lower profitability: Lower switching costs, rising costs coupled with lower willingness to pay means as your CAC goes up, your profitability goes down.
- Customer's revenue changes over time: Customers impact revenues negatively when they downgrade to a lower-paying plan or churn. On the contrary, if an existing customer buys additional products or decides to subscribe to a more expensive subscription plan, revenues are added.
Besides the SaaS Metrics, several post-sales metrics matter for faster-growing companies. They include managing and reducing churn, increasing renewal revenue, and increasing upsells, cross-sells, and upgrades.
Problems with LTV, CAC, and the LTV:CAC ratio
Several problems become obvious when we look at the LTV, CAC, and the LTV:CAC ratio in detail.
Customer Lifetime Value (LTV)
Customer Lifetime Value is a forward-looking estimate of the average revenue that a business would generate from a customer account throughout their lifespan as a customer.
LTV, CLV, CLTV, CTV, and CLT are widely used abbreviations for Customer Lifetime Value – in order of search popularity on Google.
For a business, the churn rate can help estimate LTV. The lifetime or lifespan of a customer in months is the reciprocal of churn rate.

So, a 5% monthly churn rate would mean a lifespan of 100/5 = 20 months.
And a 10% annual churn rate would mean a lifespan of 100/10 = 10 years.
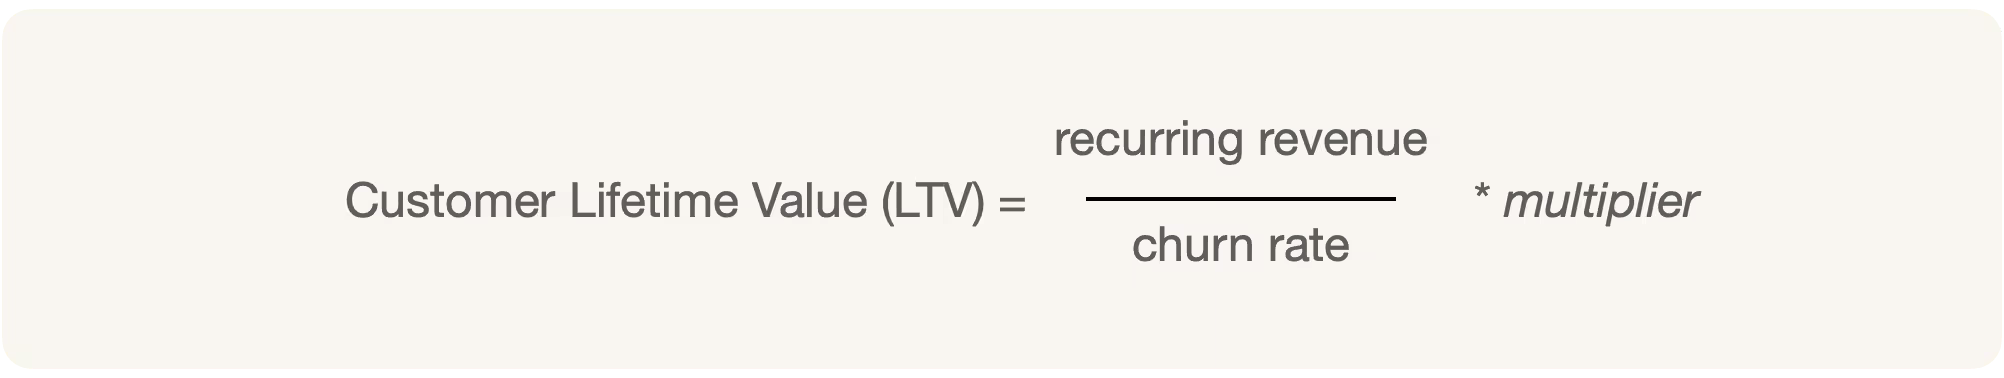
Assuming a fixed MRR of $100/month and 5% monthly churn rate, the Customer Lifetime Value (LTV) for a customer would be 20 months x $100/month = $2000. Expressing it mathematically,

And for annual contracts with a fixed ARR of $100,000/year and 10% annual churn rate, the Customer Lifetime Value (LTV) for a customer would be 10 years x $100,000/year = $1M.
The simplistic view of churn does not work for businesses with recurring revenue.
The simplistic view of churn does not work well for B2B SaaS or B2C businesses with recurring revenue, as we
- did not account for expansion revenue,
- assumed a churn rate that is constant month-over-month,
- assumed a zero price change during the period, and
- assumed the same churn rate for all customer segments.
Using the churn rate reciprocal is how we still estimate LTV.
Tomasz Tunguz modeled four different customer retention curves based on companies in his portfolio, with a 3.5% average monthly churn but drastically different churn behavior.
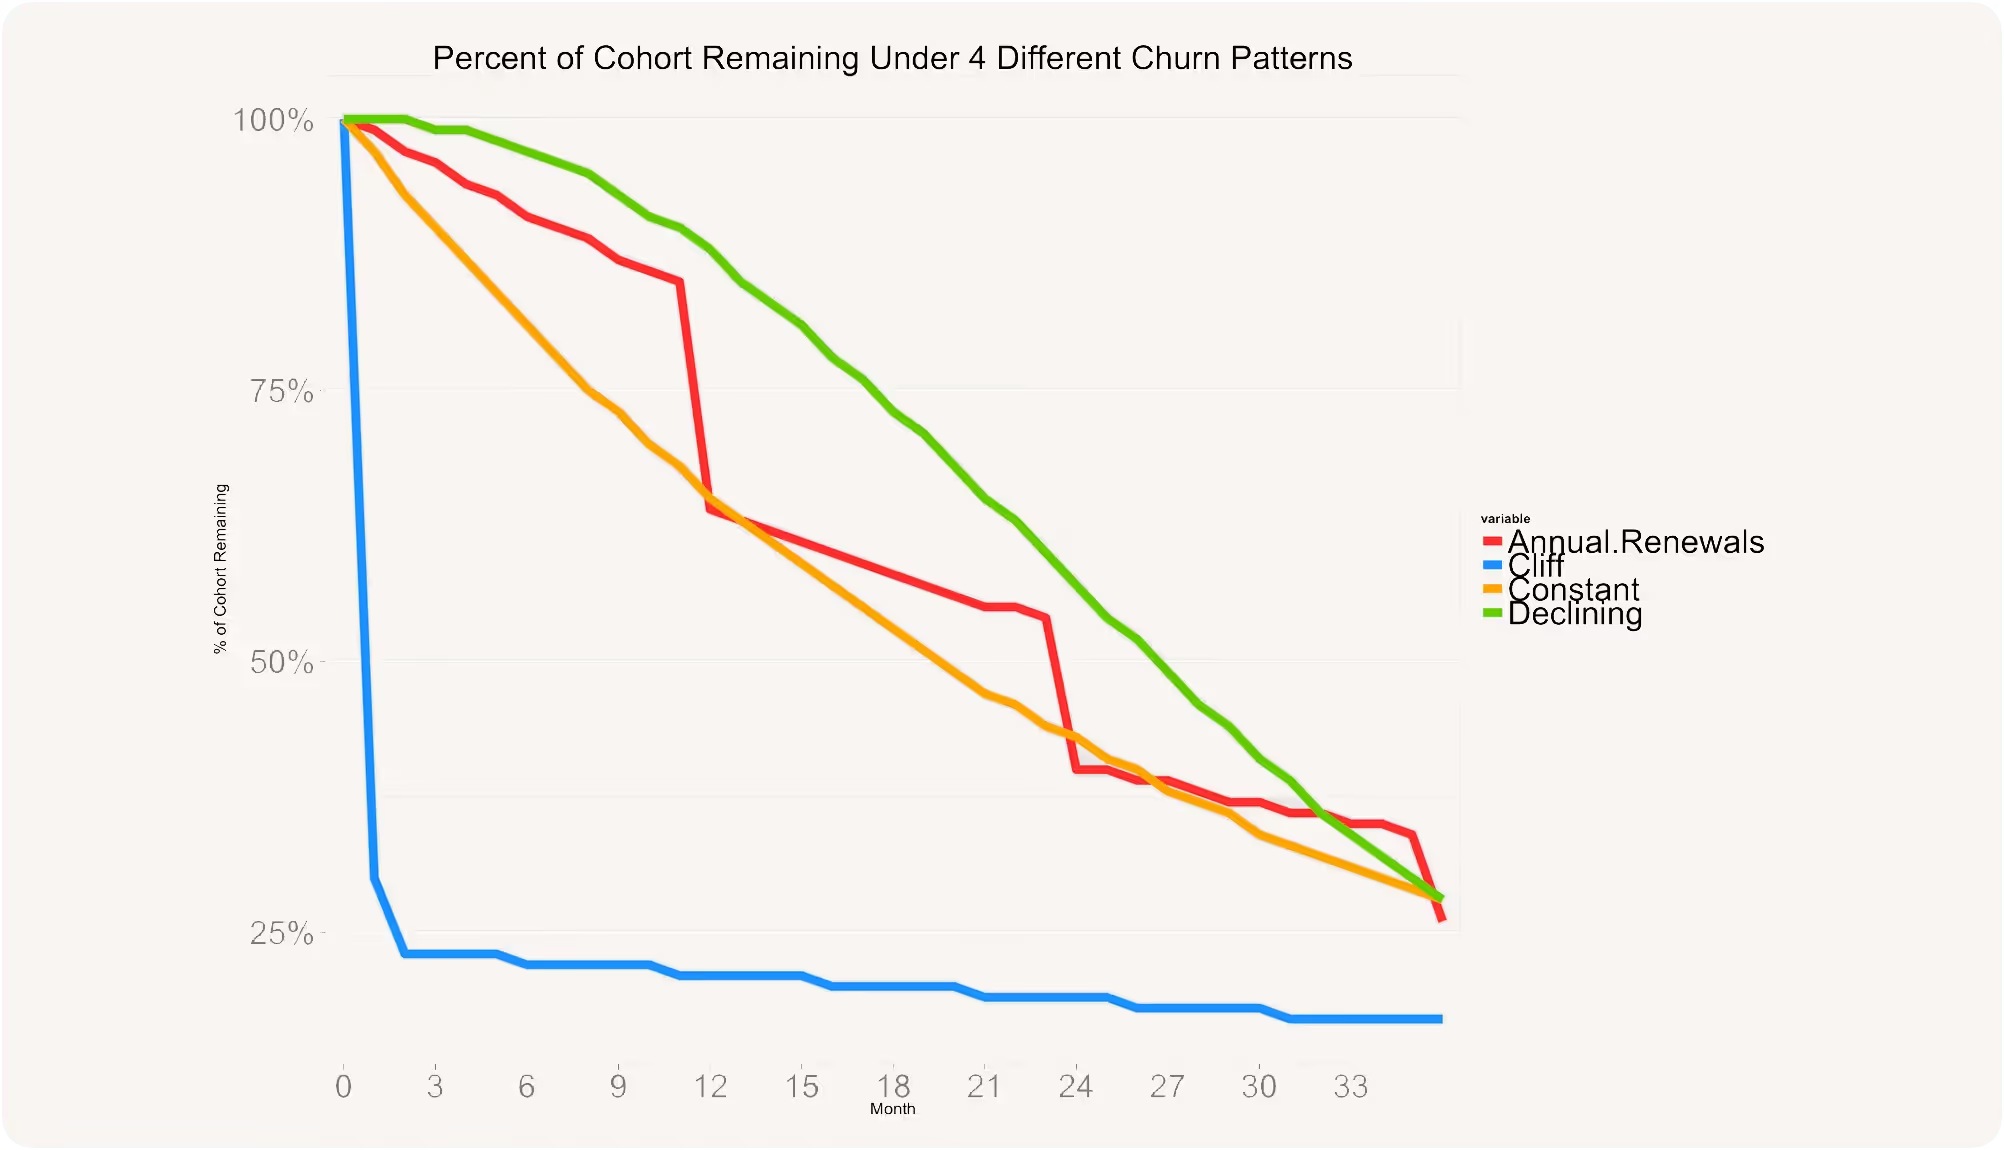
- Constant: A steady 3.5% monthly churn per month.
- Declining: Churn starts at zero and increases 0.25% each month.
- Cliff: In the first month, 70% of customers churn. In the second month, 22% of customers churn. Then only 1% of customers churn each month.
- Annual Renewals: 1.5% of these customers churn each month and another 25% churn at the time of annual contract renewal.
The LTV for the Cliff model would be significantly lower. Our LTV calculations are built on flawed assumptions.
If we were to stick with LTV – we don't have to, as we will learn below – we would account for both variable churn and revenue expansion.
Several studies point out we overestimate LTV consistently because of variability in churn. The variability in churn could be accounted for by introducing a multiplier, e.g., 0.7, to make the LTV more conservative.
So, LTV = $2000 x 0.7 = $1400.
Accounting for expansion, but assuming customer revenue increases at a constant monthly rate throughout the customer's lifespan, LTV could be (via David Skok):
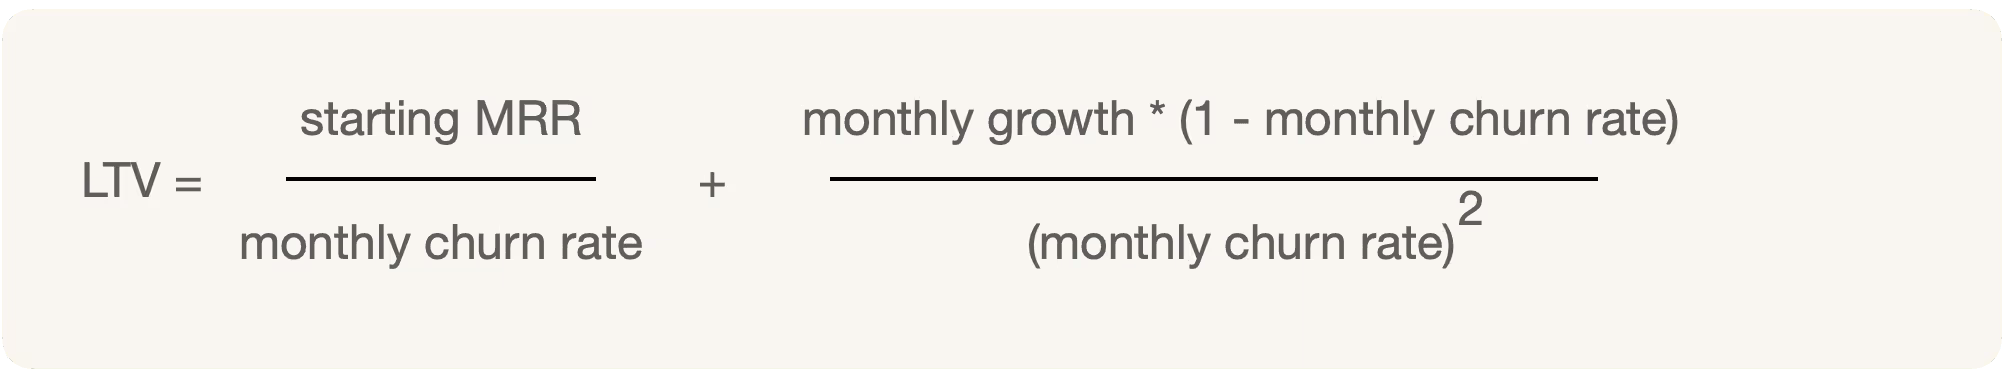
Modified LTV to account for constant growth (not recommended because of this assumption)
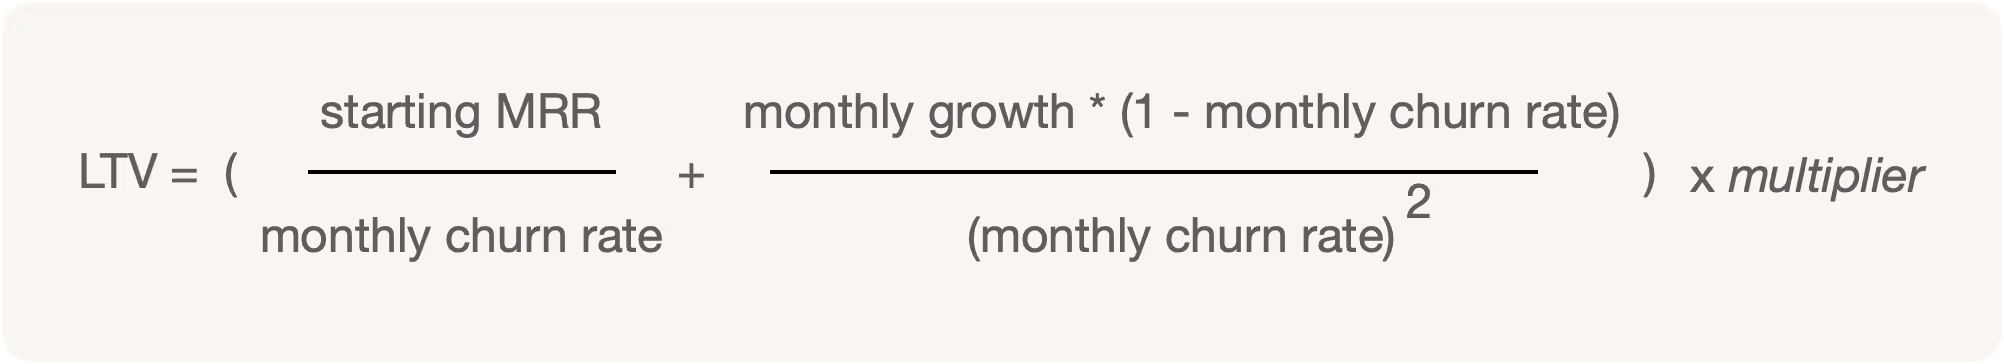
We could combine the above into the following. Still, these make two flawed assumptions: churn variability and customer revenue increases at a constant monthly rate throughout the customer's lifespan.
Customer Acquisition Cost (CAC)
Customer Acquisition Cost (CAC) is the cost of marketing and sales required to acquire a new customer, i.e., the cost to convert a prospect into a customer. It is the ratio of money you spend to attract customers and the number of customers acquired.
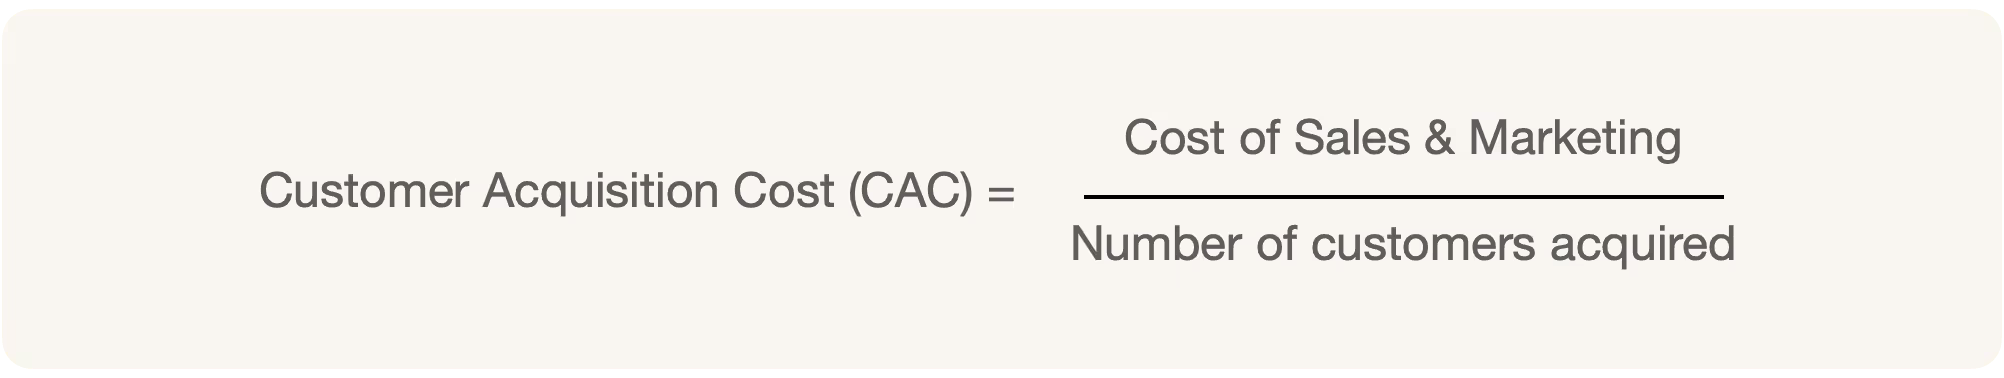
If the sales and marketing spend for a quarter totals $50000, and you acquired 100 customers, your CAC is $500.
A noticeable problem is the numerator is a dollar value and the denominator a number, i.e., it is focused on logo acquisition and not revenue.
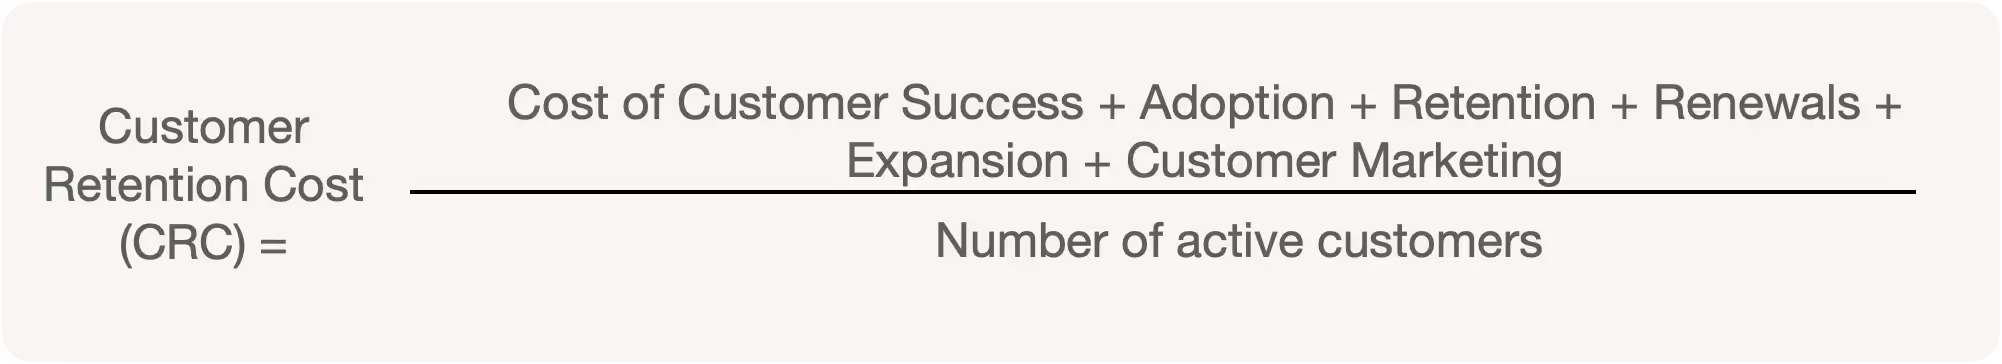
Customer Retention Cost (CRC)
Customer retention cost (CRC) is the cost of customer marketing, customer success, renewals, training, and driving adoption and loyalty, divided by the number of active customers during a certain time period. The cost includes cost of systems and salaries.
LTV:CAC ratio and age-old wisdom
The age-old wisdom regarding SaaS businesses viability has been a) LTV should be greater than three times the cost of customer acquisition and b) the cost of acquiring the customer should eb recovered within the year.

If your LTV was $2000 and CAC is $500, your LTV/CAC ratio is a healthy 4. Traditionally, anything over 3 has been considered a good number for SaaS businesses. LTV/CAC over 5 is not unusual for SaaS companies with product-led go-to-market motion.
The best SaaS businesses have a LTV to CAC ratio higher than 3, sometimes as high as 7 or 8. And many of the best SaaS businesses can recover their CAC in 5-7 months - David Skok
Months to recover CAC is directly proportional to time-to-profitability and cash flow. However, with an LTV/CAC of 5 or over, don't rule out that you may be underspending.

Problems with LTV, CAC, LTV:CAC ratio
Standard SaaS metrics like reducing Customer Acquisition Cost (CAC) and increasing Customer Lifetime Value (LTV) measure Customer Profitability (as the LTV/CAC ratio) but do not explicitly emphasize revenue from retained existing customers. There are several problems with the LTV / Churn Metrics.
LTV is an opinion - Dave Kellog.
- CAC does not account for the revenue generated per customer. Cost of customer acquisition is the cost of sales and marketing in dollars in the numerator and the number of customers in the denominator.
- Customers find value from products differently; LTV assumes a fixed churn rate across segments and across the lifetime.
- Several churn models imply several 1/churn ratios or several customer lifetimes (LTV), making predicting LTV inaccurate.
- Since several metrics are derived from LTV, downstream metrics are influenced or "polluted" by incorrect foundational metrics.
- Unreasonable LTVs — If the churn rate for a company is low, for example, 1% per year or month, the LTV becomes unreasonable. 100 * 1/ churn, or 100/1, or 100 months or years.
- Infinite lifetime problem with zero churn — If the churn rate is 0% per month or year, you get infinite churn. 1/ churn, or 1/0, or ∞ LTV.
- Negative Lifetime Value — If the Churn rate is -5%, LTV would be -20 months, or 1/ -5, -20 months. We will see negative churn and zero churn are not unrealistic.
- Ignorant of timing — Taking Dave Kellog's example in slide 7 further, if 100 units expand to 120 in the third month and renew at 105 units at the annual renewal time, is it a 5-unit expansion or a 15-unit churn
- Potential for manipulation — Like every metric we measure and report on, the LTV/CAC ratio may be manipulated to fit positive reporting needs. A company with a high churn in the first 45 days may choose to remove customers churning in the first 45 days. A company may exclude customers that spend less than a specific dollar amount per month. Again, a common occurrence, as we will see in some S-1s below. Companies may offer free or negligible cost renewals to a customer to avoid a Logo churn. But, again, if there is a chance to resurrect the customer, this may be considered a strategic investment.
- Public companies rarely disclose churn numbers.
Other than an ambiguous numerator and denominator, LTV/CAC is a perfect ratio - Dave Kellog.
Key metric components behind NRR and NDR
If we were to construct the perfect revenue-based metric what would it be? Let us look at the components that matter to faster-growing companies.
Customer Success 2.0 = Net Dollar Retention - Nick Mehta
Customer & revenue churn
Churn reveals whether a product delivers continuous value to your customers. As growth slows with scale, churn provides the upper bound on how big a company can become.
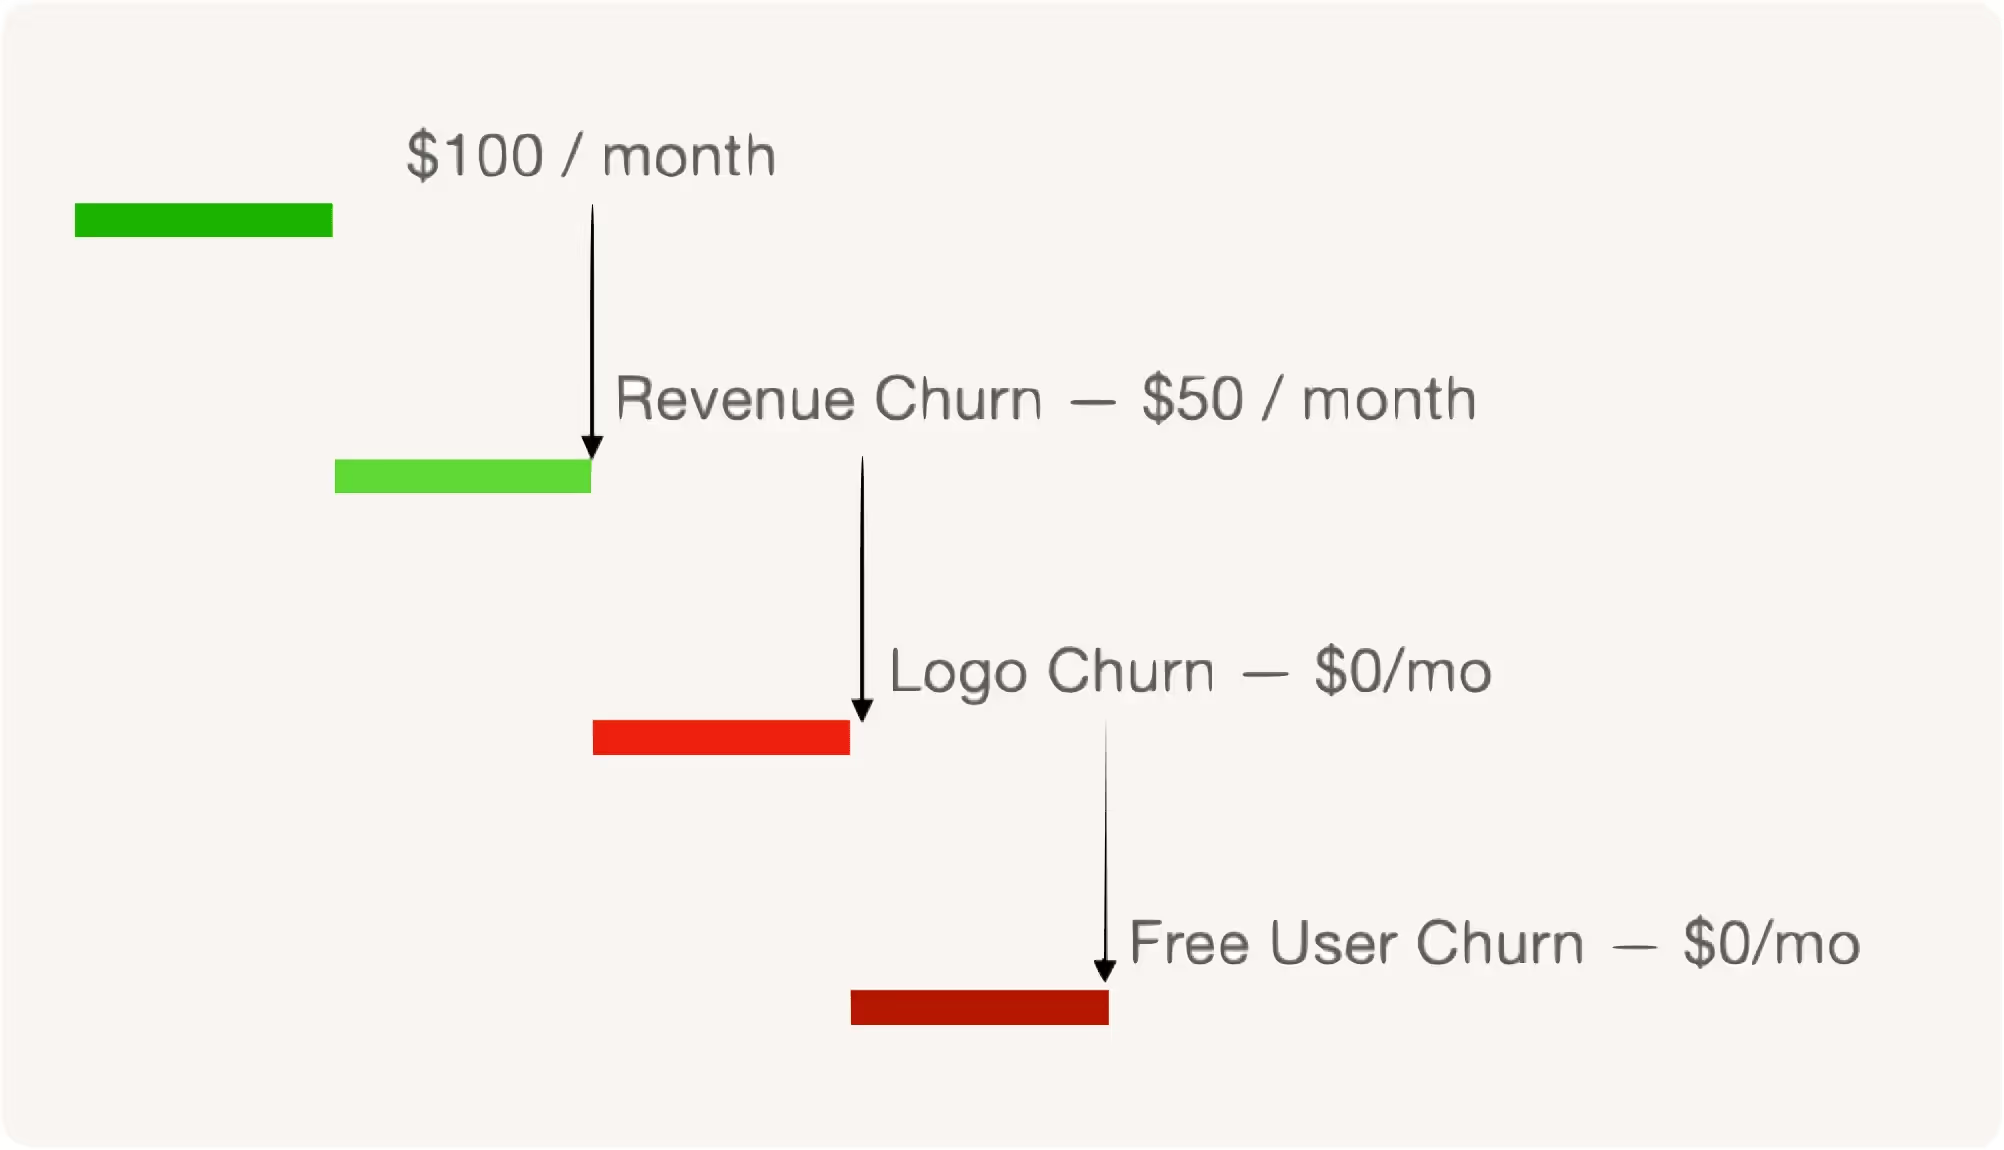
In his book, Sevens Pillar of Customer Success, Wayne McCulloch describes the difference between Logo Churn and Revenue Churn using Netflix as an example.
Revenue churn occurs when the customer stays but pays you less. For example, you might be a subscriber to Netflix Premium, but wake up one day and say, "You know, I'm not using it that much, so I'm going to change my subscription to pay less." You're not switching brands; you're just downsizing. — Wayne McCulloch
Revenue Churn is also known as down-sell or contraction.
Logo churn happens when the customer leaves and doesn't renew. For example, let's say you have a Netflix subscription, but you decide to drop Netflix and switch to Hulu because it has a better selection or costs less. That's logo churn, leaving one brand for another. — Wayne McCulloch
Logo Churn is also known as Customer Churn.
Free User Churn
Churn is bad for your business. Or more accurately, high churn is bad for business.
Logo churn is worse than revenue churn, considering the cost of resurrecting a lost customer is almost as high as acquiring a new customer (Bain research).
It may be better if you can offer a churning customer to switch to a free plan, if you provide one, instead of abandoning altogether. Then, you will have a high chance of converting them back into a paid tier when new features are released or the existing product is improved.
Selling to an existing customer base is cheaper than selling to new customers. But, of course, if it doesn't cost you considerably more to support free users.
A free user churn happens if the user is not willing to consider a free account. She deletes her account profile or takes away the permission to contact her via email.
SIDEBAR: One dozen reasons why customers churn
Customers churn for several reasons. Some are related to the product and are avoidable others are related to the customer's business and unavoidable.
In working with a number of SaaS portfolio companies, I have found that there are two causes of churn that occur more frequently than any others. They are:
• failure to successfully onboard the customer and
• loss of the champion who drove the purchase. — David Skok
- Pricing & pricing model — Customers churn because of the way you price, especially true for commodity products.
- Value — Customers are not getting timely desired value from the product.
- Value is not communicated — Value is not communicated to the functional, executive, or economic buyers. QBRs and EBRs are infrequent and ineffective.
- Value is not communicated continuously — Value is not communicated to the functional, executive, or economic buyers continuously. You are not relying on continuous Digital Business Reviews (DBRs).
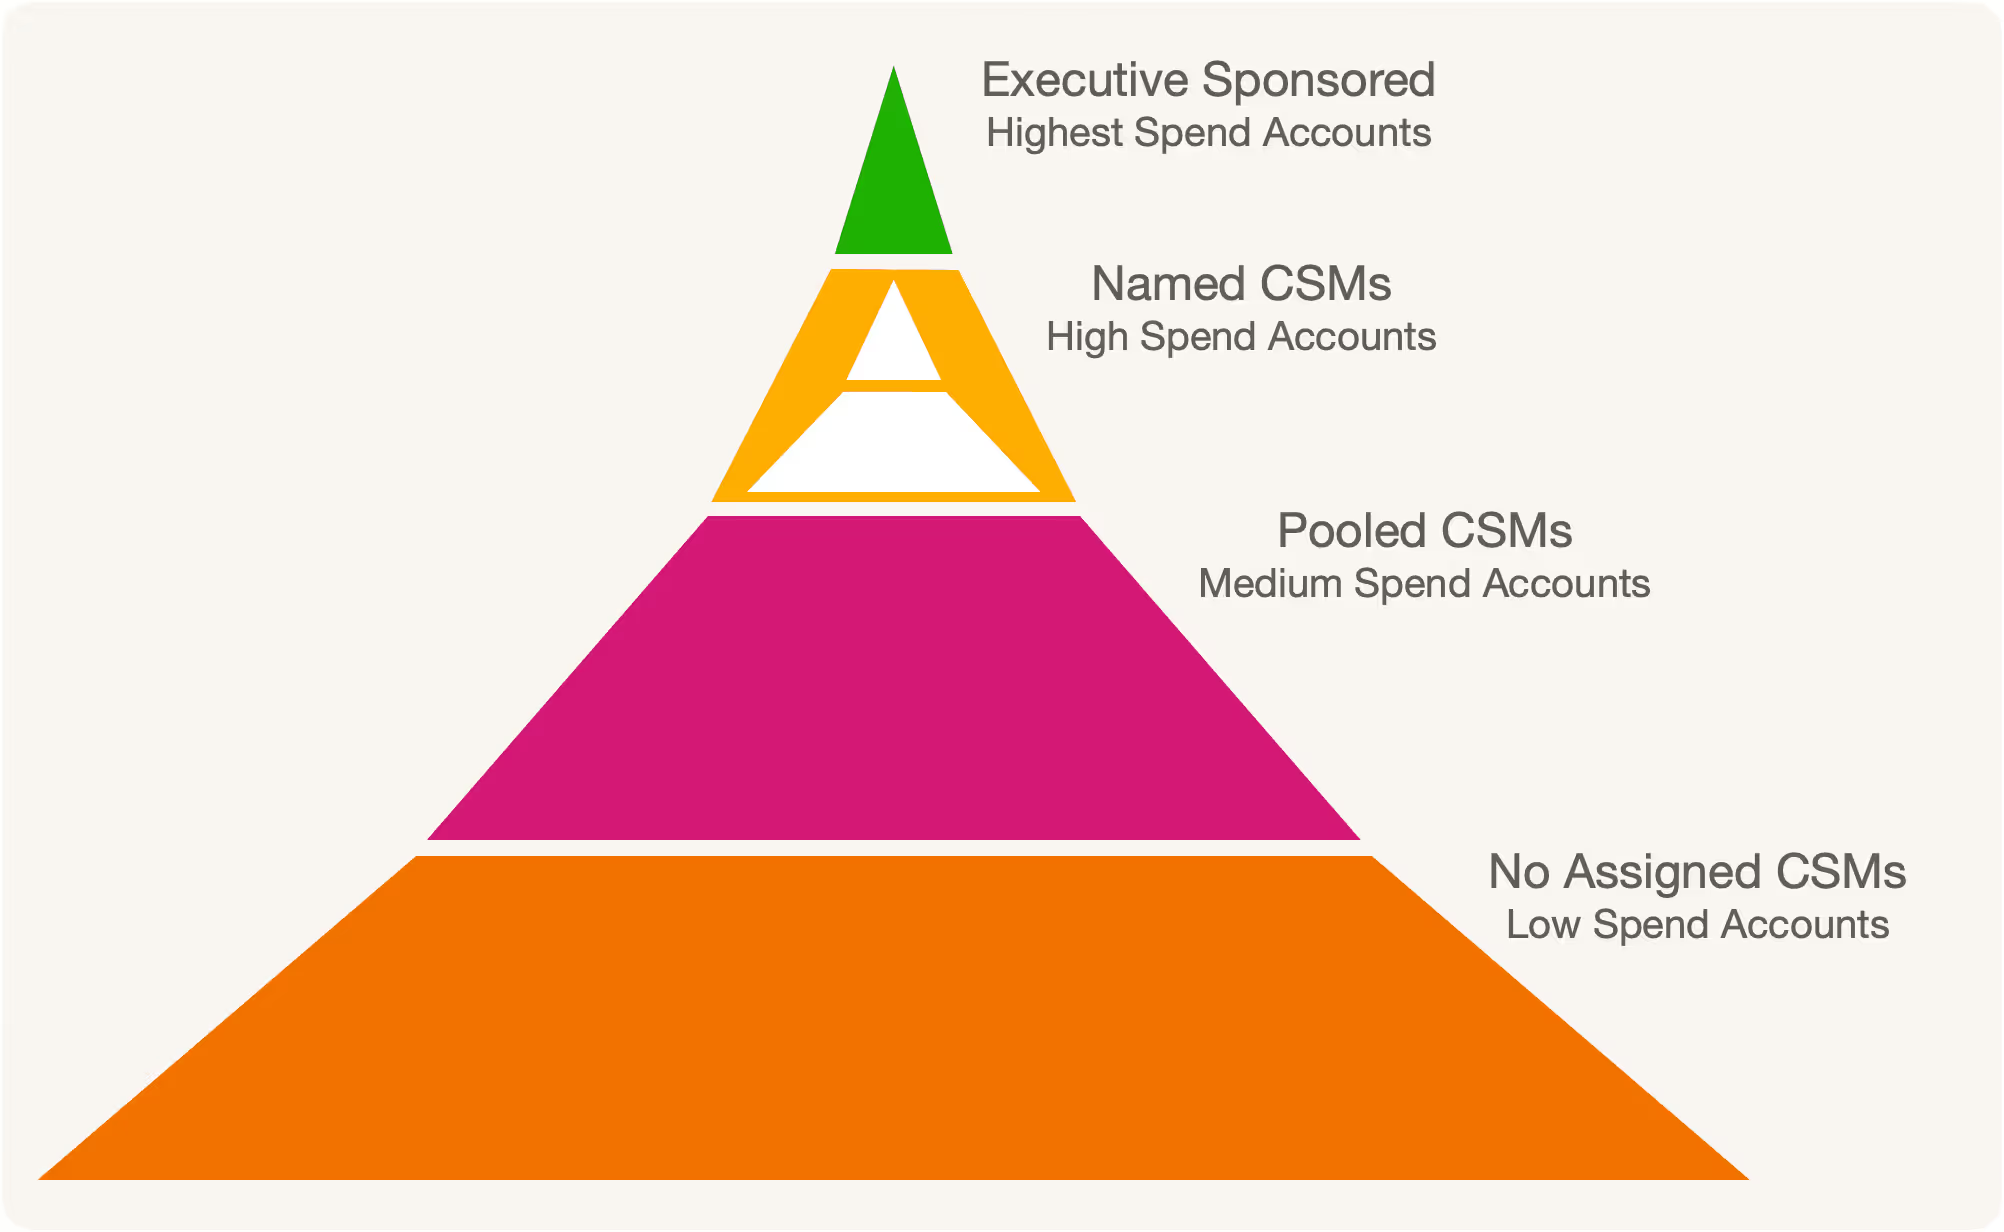
- Customer Success limited to high-touch segments — Customer Success is lacking or limited to high-paying segments.
- Micro Pyramids — CSMs are paying more attention to bigger accounts within their portfolio of named accounts. This - in addition to we paying zero attention to low and medium spend accounts.
- Competitor-driven churn — Competitors are offering better value and a lower price.
- Product-customer fit — Selling to customers who aren't a good fit for the product.
- Experience — Bad user experiences due to buggy products, bad support, lacking customer success.
- Onboarding — Lack of customer education and proper onboarding. You are not providing proper onboarding to users of your product.
- Executive Onboarding - You are not onboarding executives and economic buyers. Onboarding economic buyers is equally if not more important. They direct their teams and if they know the value for product provides, they will find time for users to onboard.
- Feature bundling — features customers do not need are bundled together, and therefore the price to value ratio does not make sense.
- Cash-flow problems at Customer.
- Loss of Champion or Executive Sponsor at Customer.
Revenue Expansion: Upsells, cross-sells, and add-ons
Companies drive revenue expansion by either upselling, cross-selling, or with add-ons.
- Upselling is selling an expensive and more feature-rich version of a product.
E.g., Upselling an iPhone 12 Pro Max with 512 GB capacity versus 128GB base. - Cross-selling is selling a related or similar product to the one the customer already has.
E.g., selling a four-pack of Air Tags with an iPhone purchase. - Add-on is cross-selling additional functionality and features on top of what the customer already has.
E.g., Adding MagSafe charger or magnetic credit card wallet accessories.
Customers get several aha-moments when they start using a product. The best time to upgrade from a free product to a paid product (or upsell to a high-priced tier) for a SaaS is right after the customer gets an aha-moment with your product. For instance,
- when a user finds the product value for the first time,
- after using the product several times and the product is adopted in their workflow, and
- when they start telling others about it or inviting other users to collaborate.
Side grades
I should mention side grades — an uncommon term used in the telecom and cable industry for completeness.
We learned this from our customer Comcast. We initially assumed it was the same as revenue churn or downgrade. I.e., offering a lower-priced service to customers who want to cancel or churn. However, we soon learned it could often be a more profitable service provided at a low, same, or higher price than an exciting service it replaces.
It is also used by our customer Google to incentivize moving an on-premise Looker account to Google Cloud.
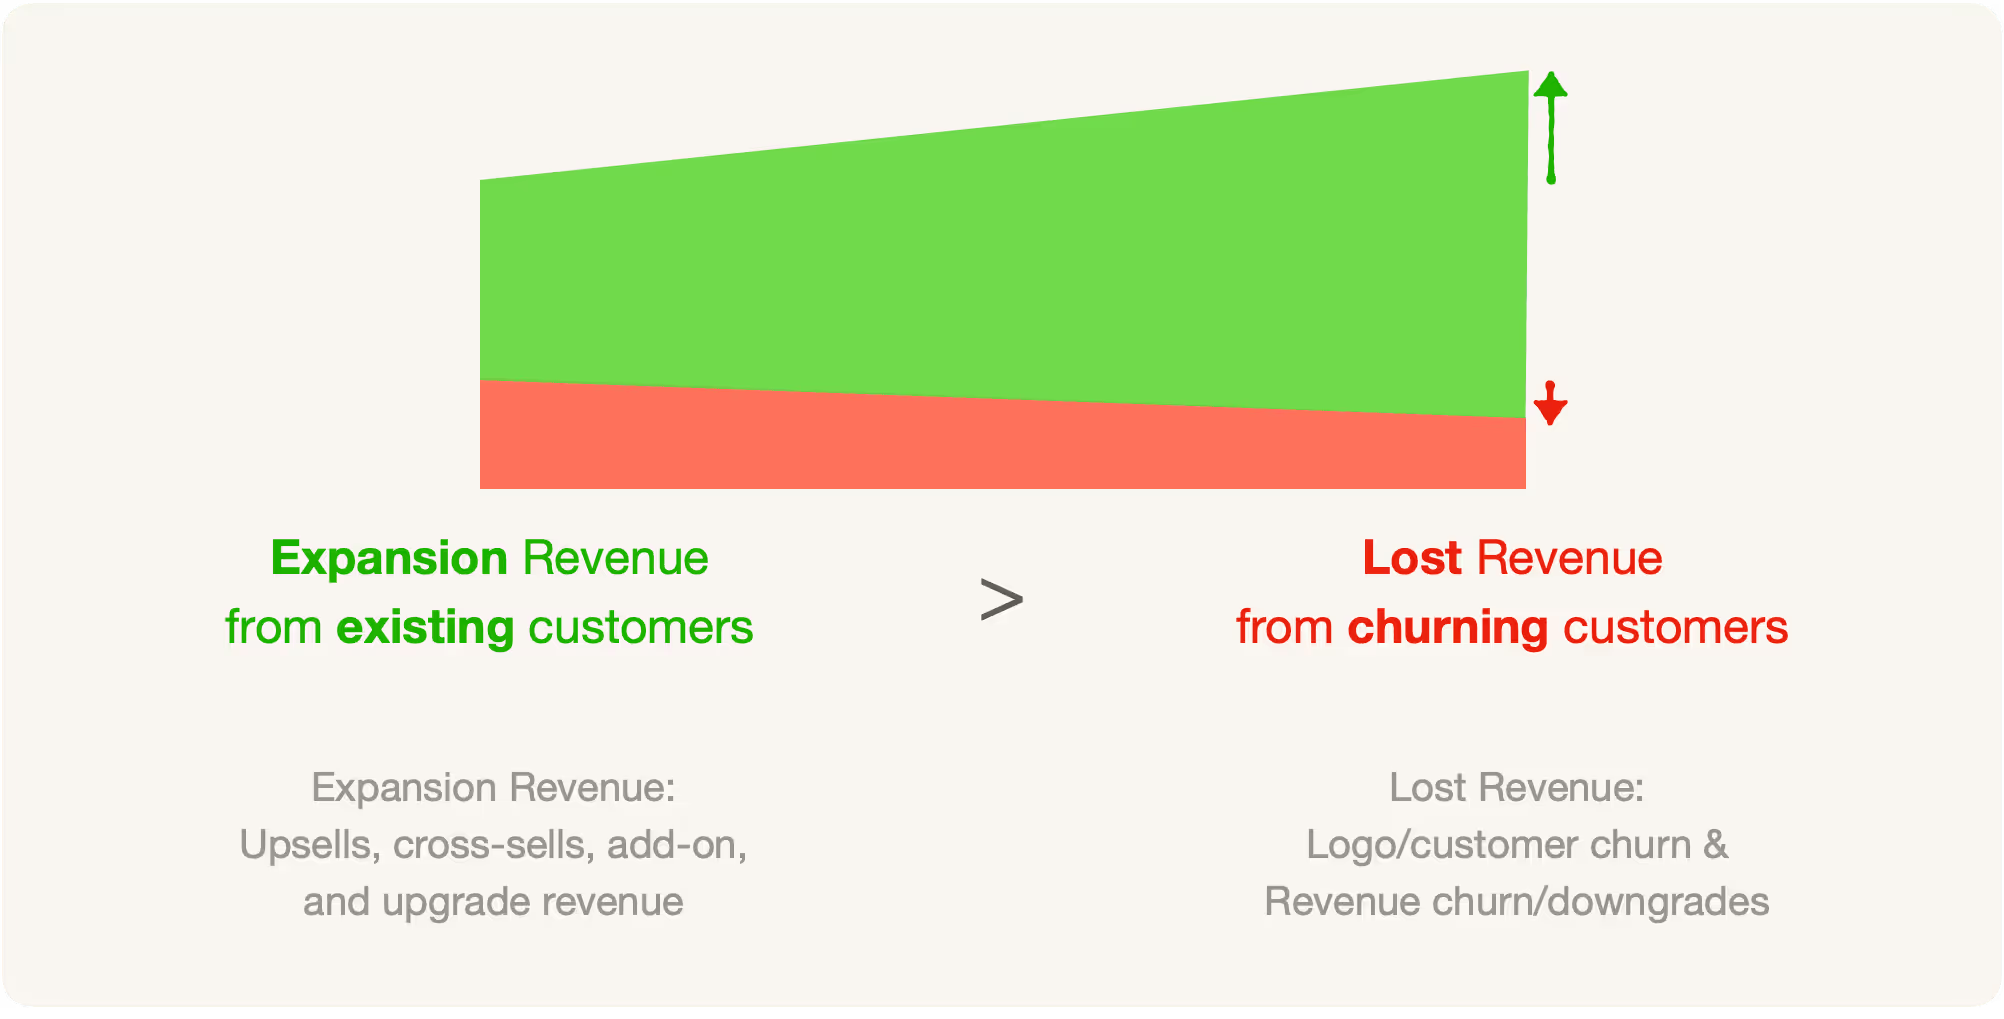
Net Negative Churn
Net Negative Churn happens when expansion revenue from all existing customers is greater than the lost revenue from all churning customers.
The total churn (customer or logo churn and down-sell or revenue churn) is offset by your existing customers spending more (upgrades/upsells, cross-sells, and add-ons) in total during the same period.
That means your recurring revenue would grow even if you did not add a single new customer. Now that is powerful.
You are achieving net positive revenue retention—more on this compounding effect below.
Renewals
If the customer is getting value from a product and the value is communicated to the stakeholders frequently, renewals should be no brainers.
Communicating value continuously is critical. The last thing a customer wants is to hear once a year from an account manager at the time of renewal.
Yearly renewals are an opportunity to explain the value, upsell, cross-sell, upgrade, raise the price, and even renew for multiple years.
Is some churn bad?
Not Really.
B2B SaaS and B2C SaaS companies constantly must fight against customer and revenue churn. But is some churn bad?
SaaS products host applications and make them available to their customers for immediate use with minimal investment. According to Forrester, 75% of B2B customers would instead try a product and self-educate than learn from a sales representative.
Customers prefer to try a product quickly through a free trial, freemium model, or even pay for a month or two. Customers can sign up for a product quickly without talking to a salesperson. They can use the software easily.
Product-led companies make it relatively easy for the customer to self-educate and self-onboard with onboarding checklists, product bumpers, and educational videos. Customers can try the product and continue using it if it provides value. If the product does not work to their expectations, they churn.
Just like onboarding to your product is easy, offboarding and switching to another software provider doesn't involve much effort.
Some products have a considerable cliff churn model. For example, In the first month, 70% of customers churn. In the second month, 22% of customers churn. Then only 1% of customers churn each month.
In the Annual Renewals Churn model, 1.5% of these customers churn each month and another 25% churn during the annual contract renewal.
Reducing Churn is crucial, but some Low Churn is perfectly okay. High churn is, however, a problem that should be addressed.
Overall, retaining existing customers who are finding value is crucial for a SaaS business.
Forget about zeroing churn. Some churn is not bad, high churn is. You make your product easy to switch to and your competition is doing the exact same thing. Your MOAT does not apply equally to every customer.
Churn Manipulation
Note, churn is not a GAAP-compliant accounting metric. It is easily manipulated or reported to make it look good. Jason Lemkin has a short list here.
Customer Success Revenue metrics
Using upsells or upgrades, cross-sells, add-ons, revenue churn, logo churn, and renewals, we define NRR, NDR, GRR, and the rates below.
What is Gross Revenue Retention?
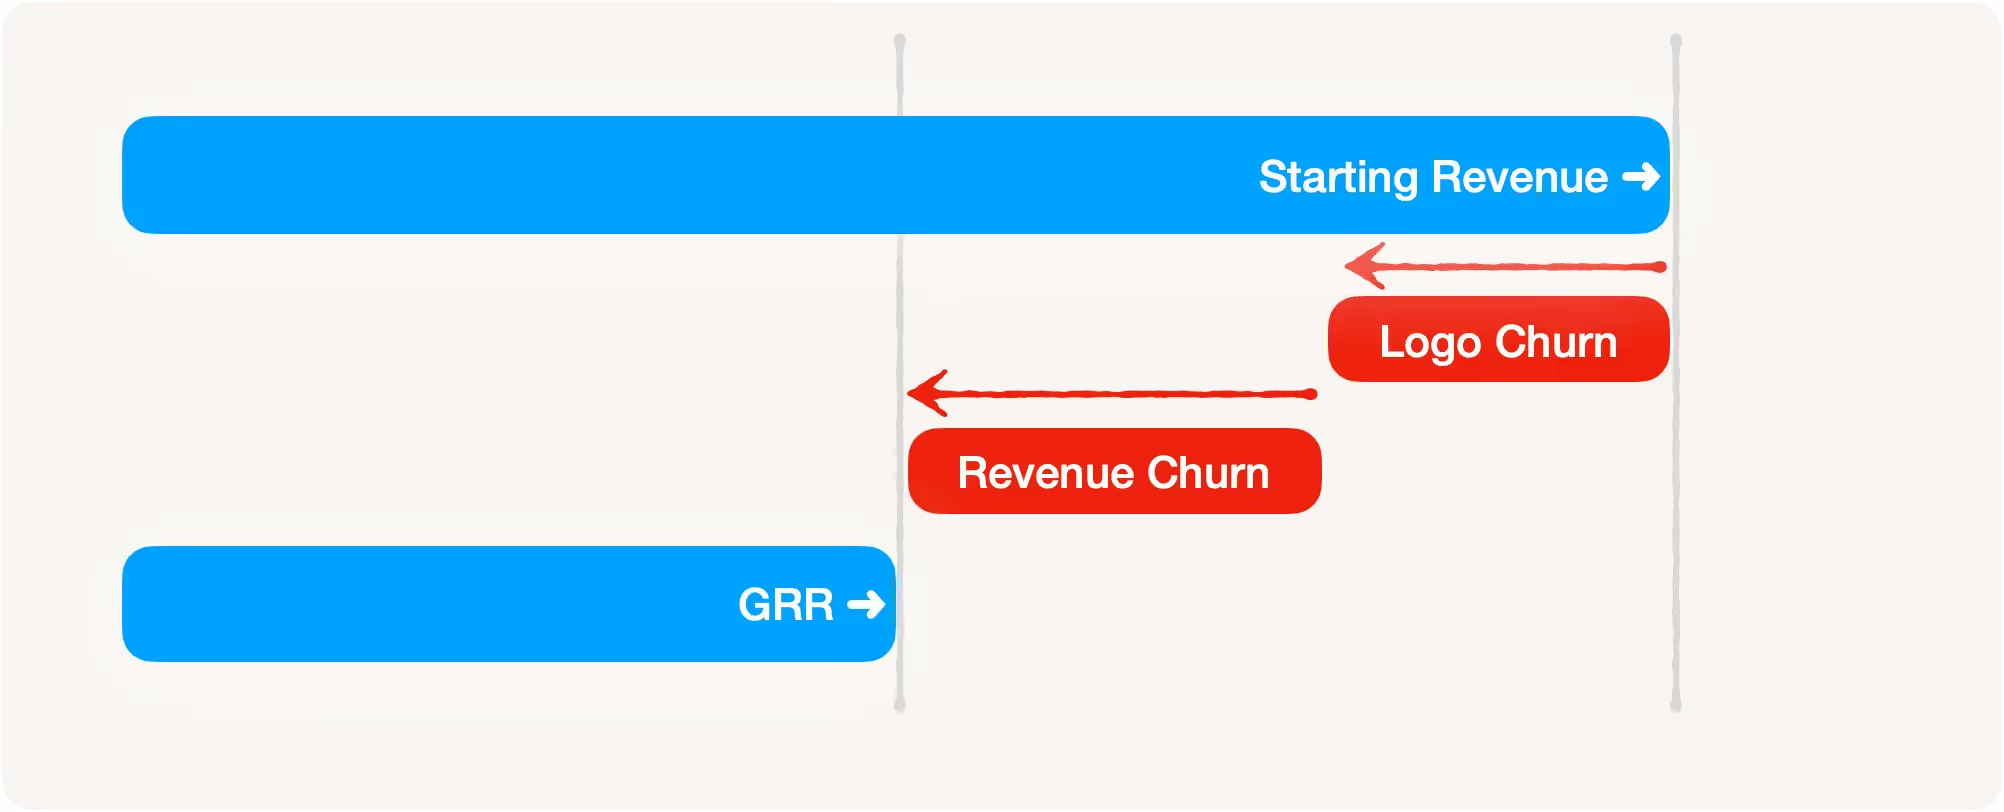
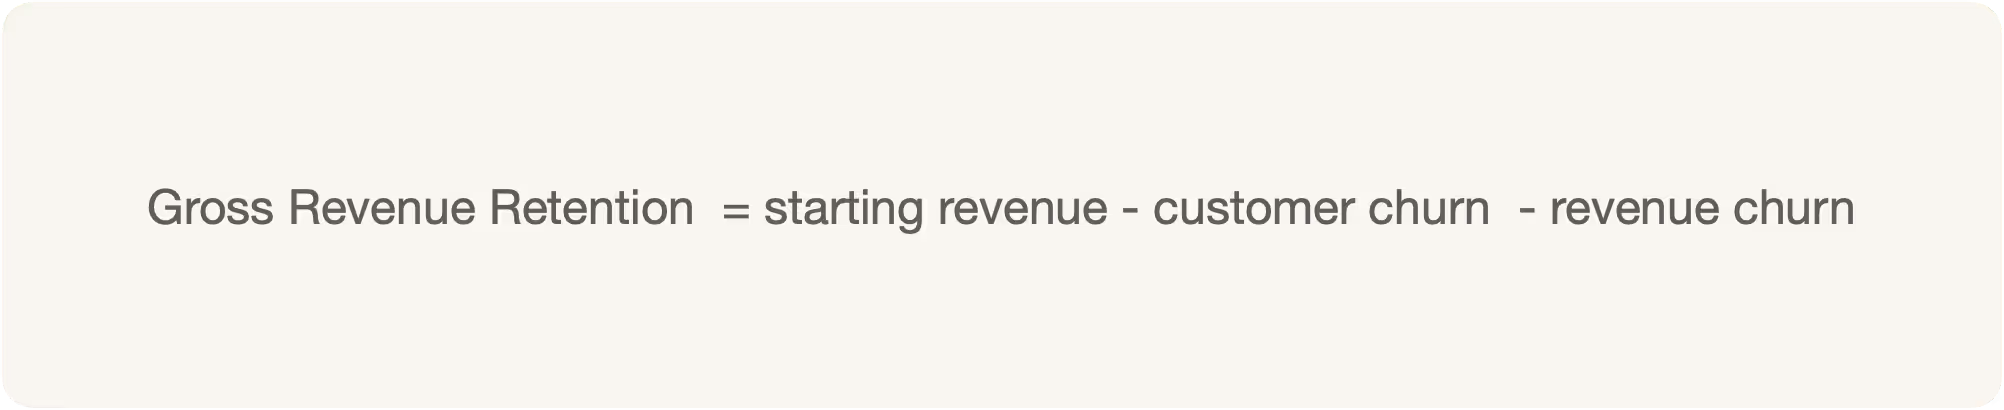
Gross Revenue Retention (GRR) is the revenue at the beginning of the period minus the churn at the end of the period, where churn includes cancellations or logo or customer churn and downgrades or revenue churn.
Revenue churn occurs when the customer stays but pays you less. Logo or customer churn happens when the customer leaves and doesn't renew.
GRR is equal to the starting revenue minus all churn in a period.
If the revenue at the end of June was $4M and customer and revenue churn in July was $300K and $200K,
GRR for July = $4M - $300K - $200K = $3.5M.
What is Gross Revenue Retention Rate?
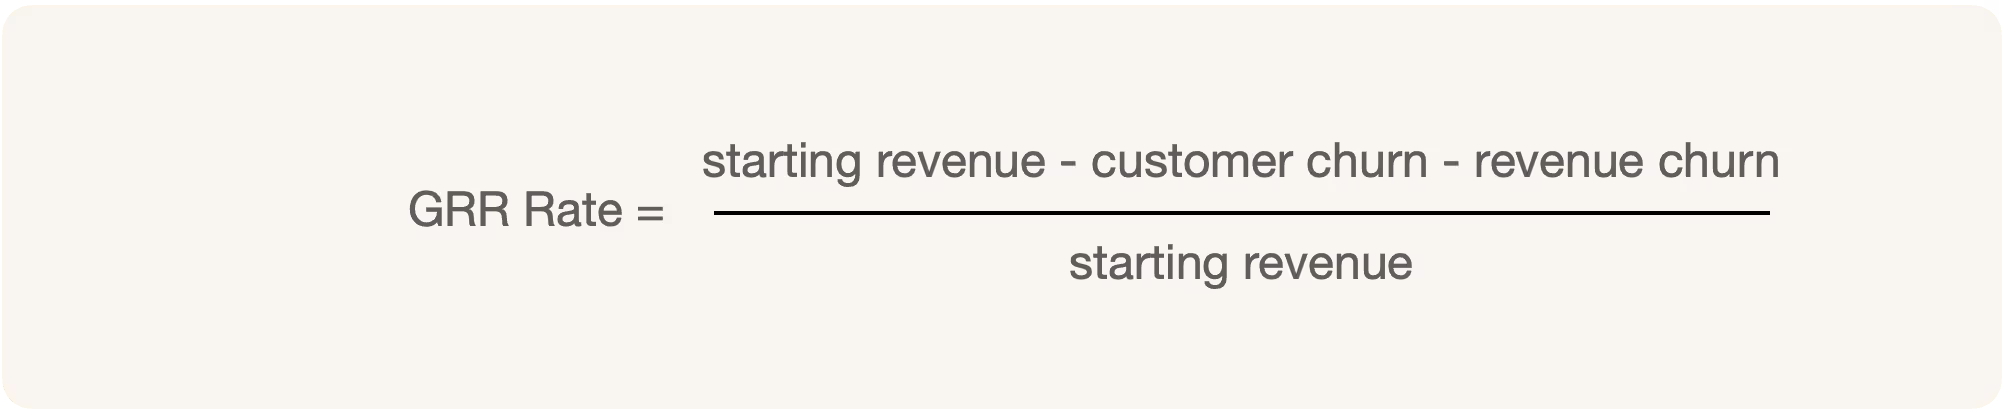
Gross Revenue Retention Rate is the revenue at the beginning of the period minus the customer and revenue churn at the end of the period, divided by the revenue at the beginning of the period.

Continuing with our example, if the revenue at the end of June was $4M and customer and revenue churn in July was $300K and $700K,
GRR Rate = ($4M - $300K - $200K) / 4M = 3.5/4 = 87.5%
Is GRR represented as ratio or a dollar value
GRR Rate is many times just abbreviated as GRR.
You will see several examples of GRR being states as ratio, percentage, or dollars in S-1 or the 10K SEC statements. If it is represented as a ratio or percentage, it is the rate. If expressed as a dollar value, it is not.
GRR expressed as a ratio or percent, i.e., 0.875 or 87.5% is a rate, and GRR expressed as a dollar value, i.e., $3.5M is GRR.
What is Gross Dollar Retention?
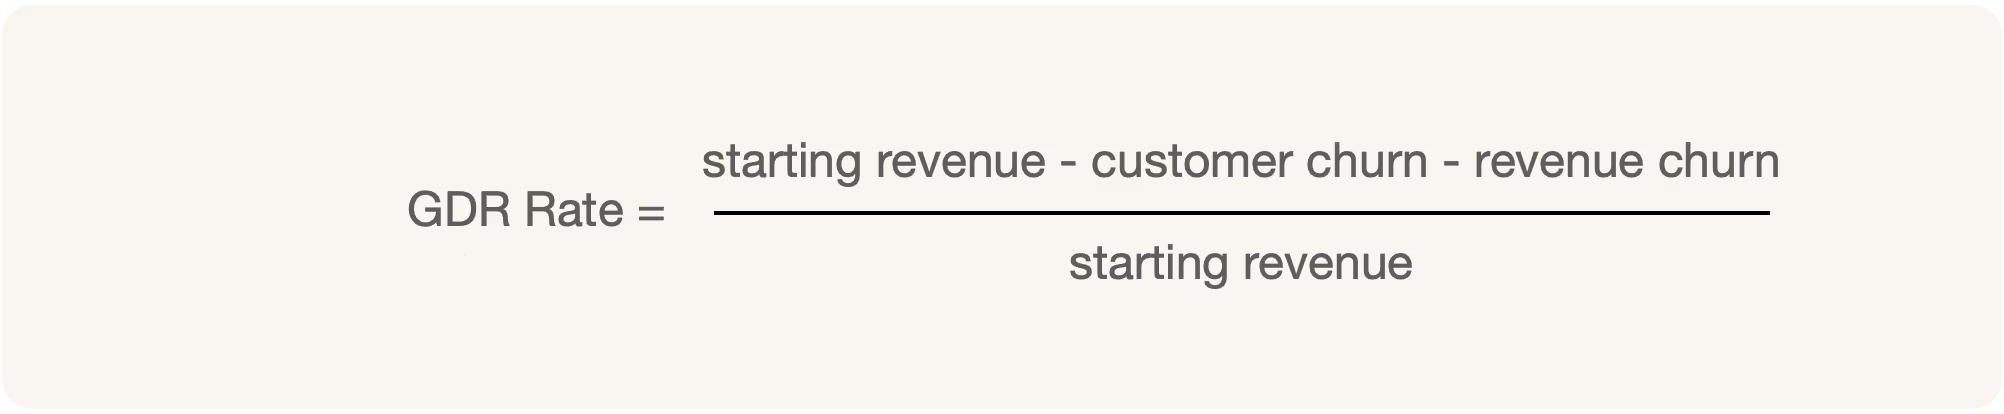
Gross Dollar Retention (GDR) is the starting revenue converted to dollars minus the churn converted to dollars both based on the actual exchange rates.
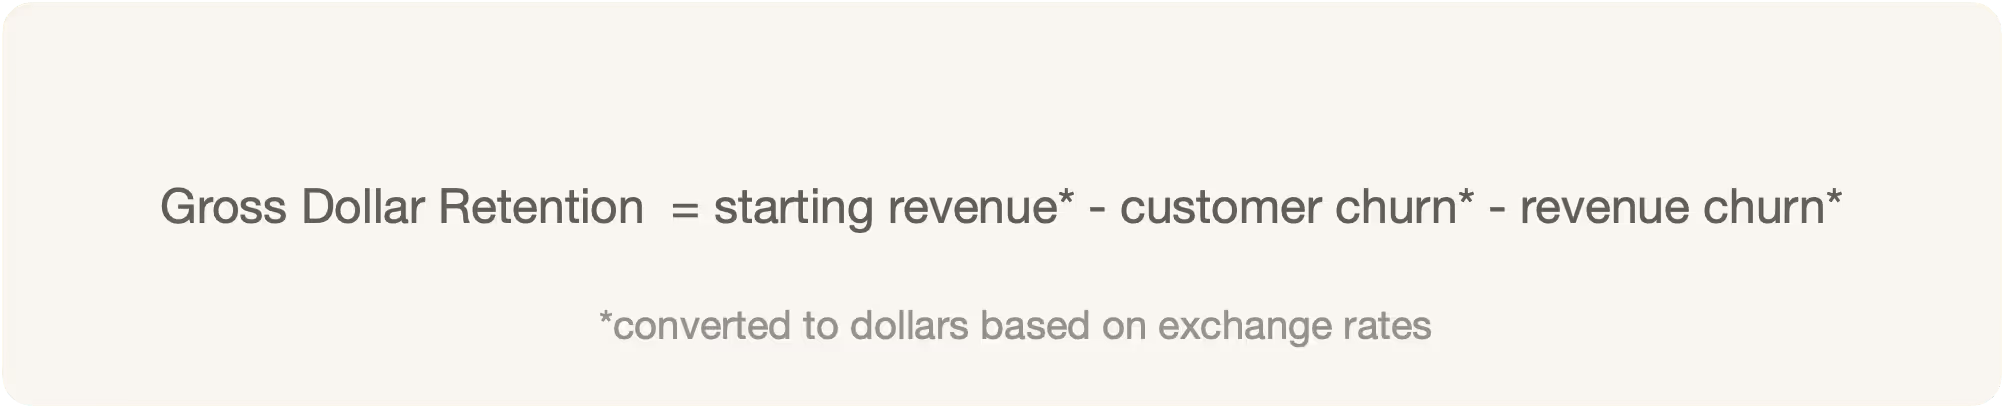
Gross Dollar Retention (GDR) is the starting revenue converted to dollars minus the churn converted to dollars, divided by the starting revenue in dollars, for a given period.
It is the same as the GRR rate, with the difference that all calculations are done in US dollars and it accommodate currency fluctuations.
GDR and GRR differences, i.e., accommodating for currency exchange and fluctuations, are highlighted in S-1 and 10-K reports by public companies. For, customer success, they are the practically same.
What is Net Revenue Retention?
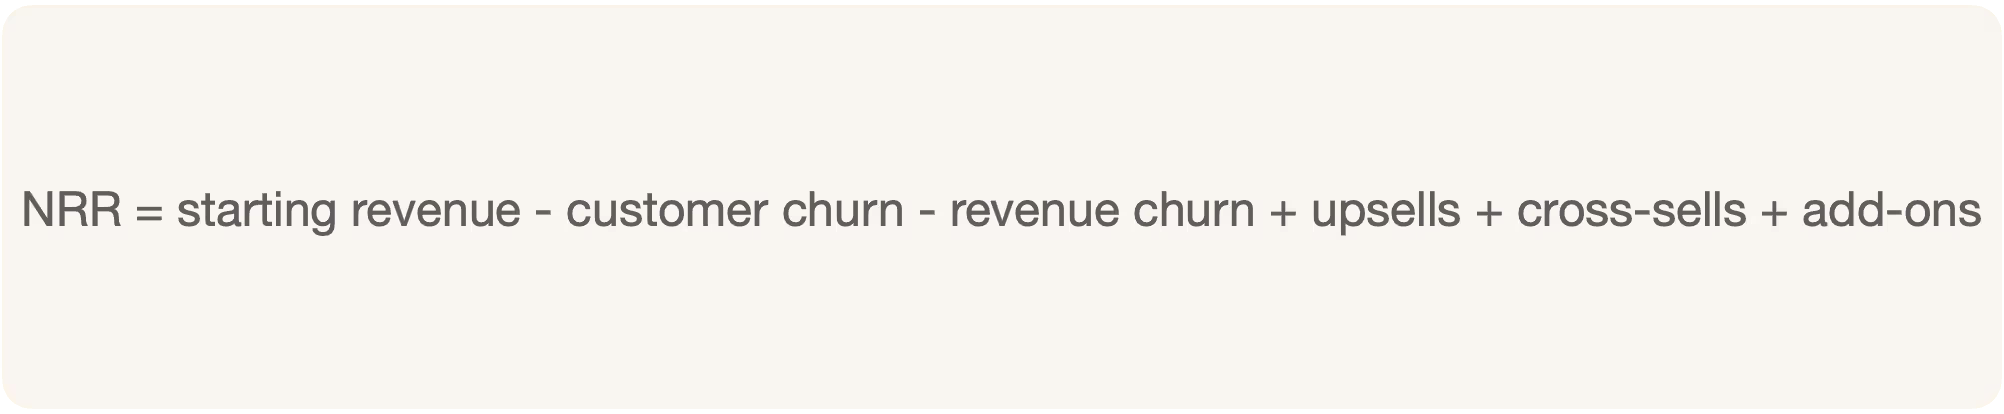
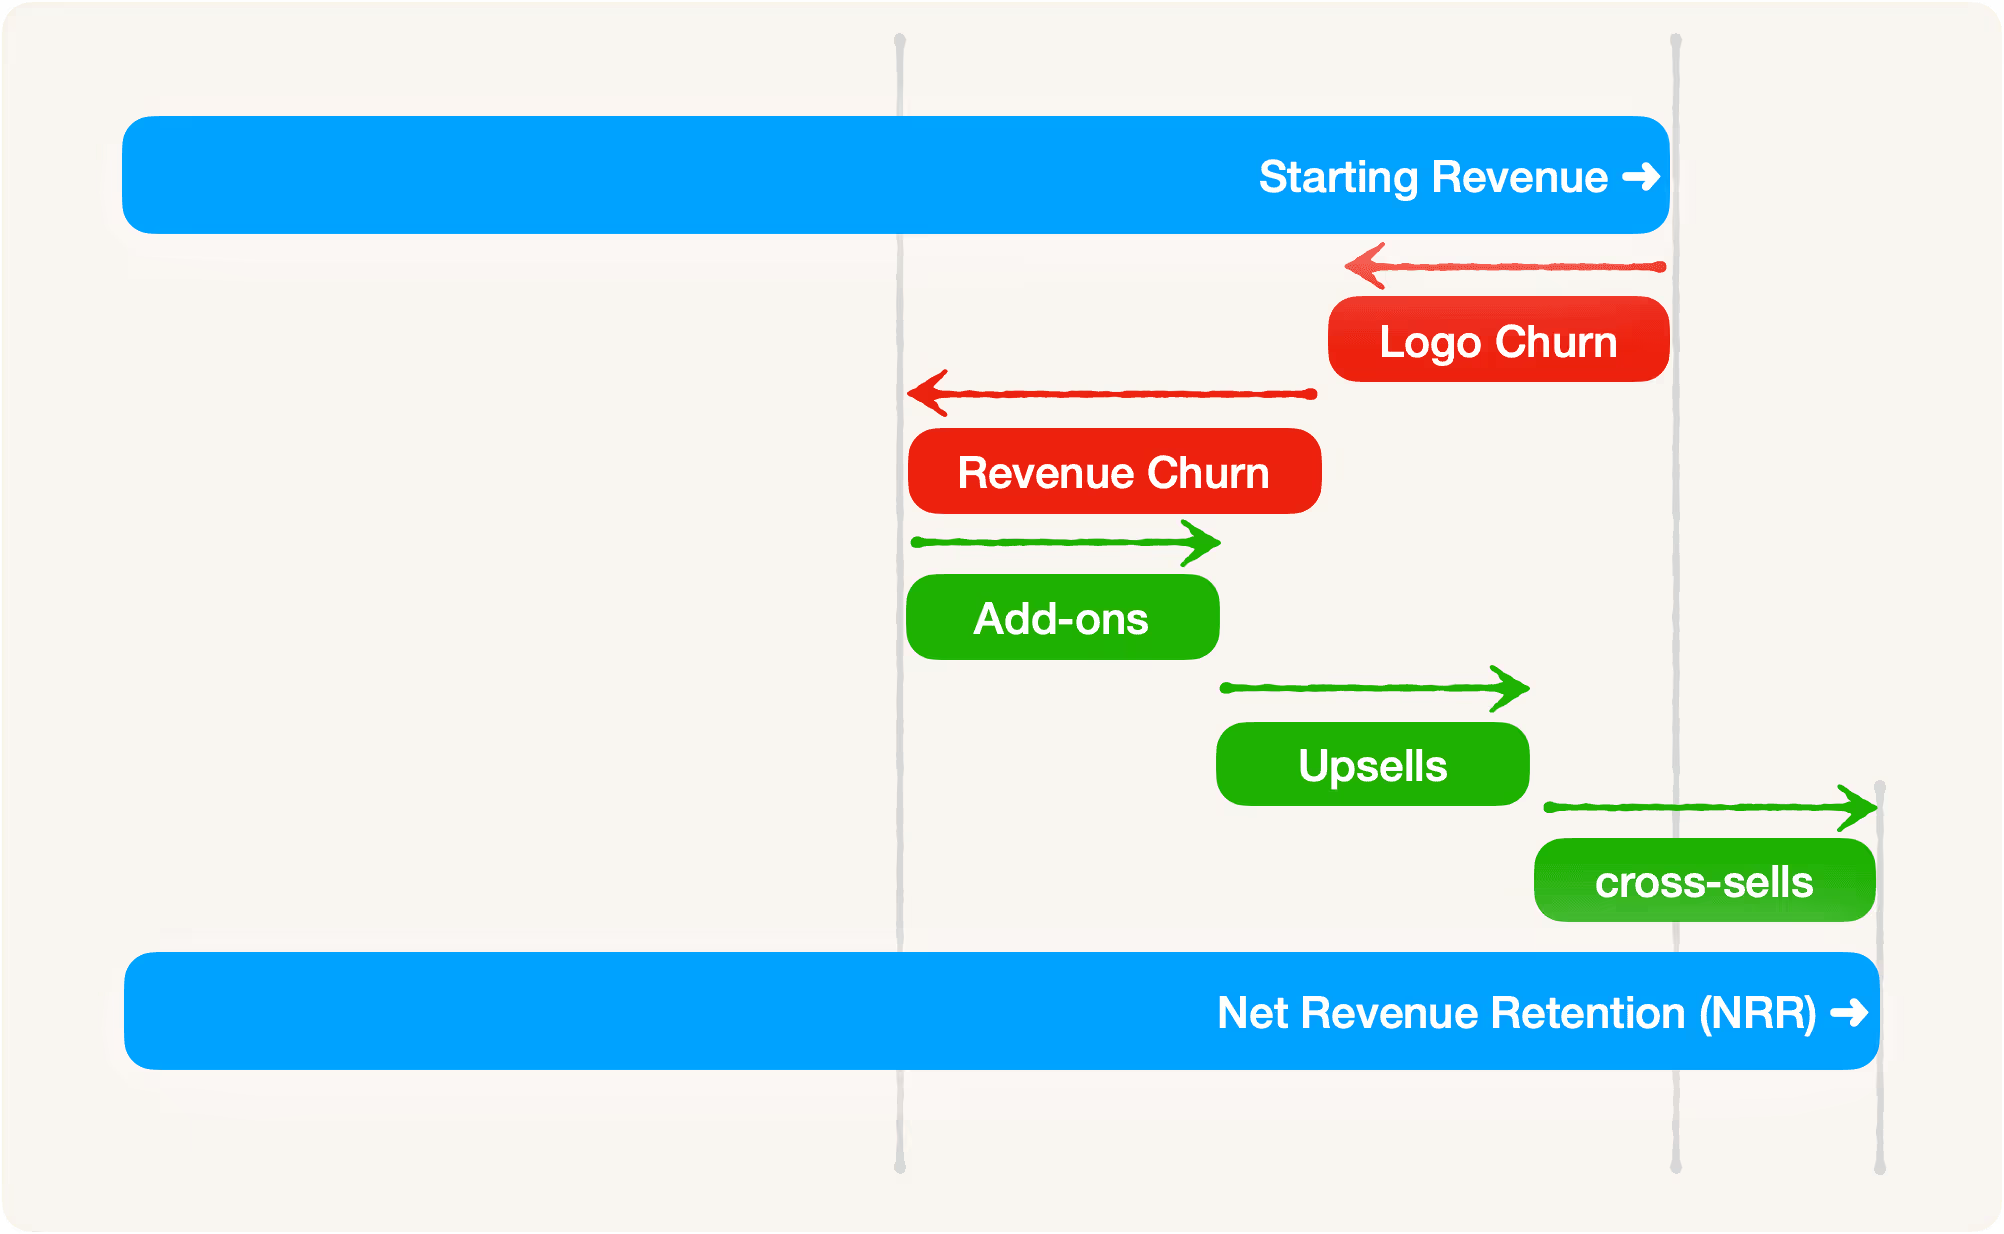
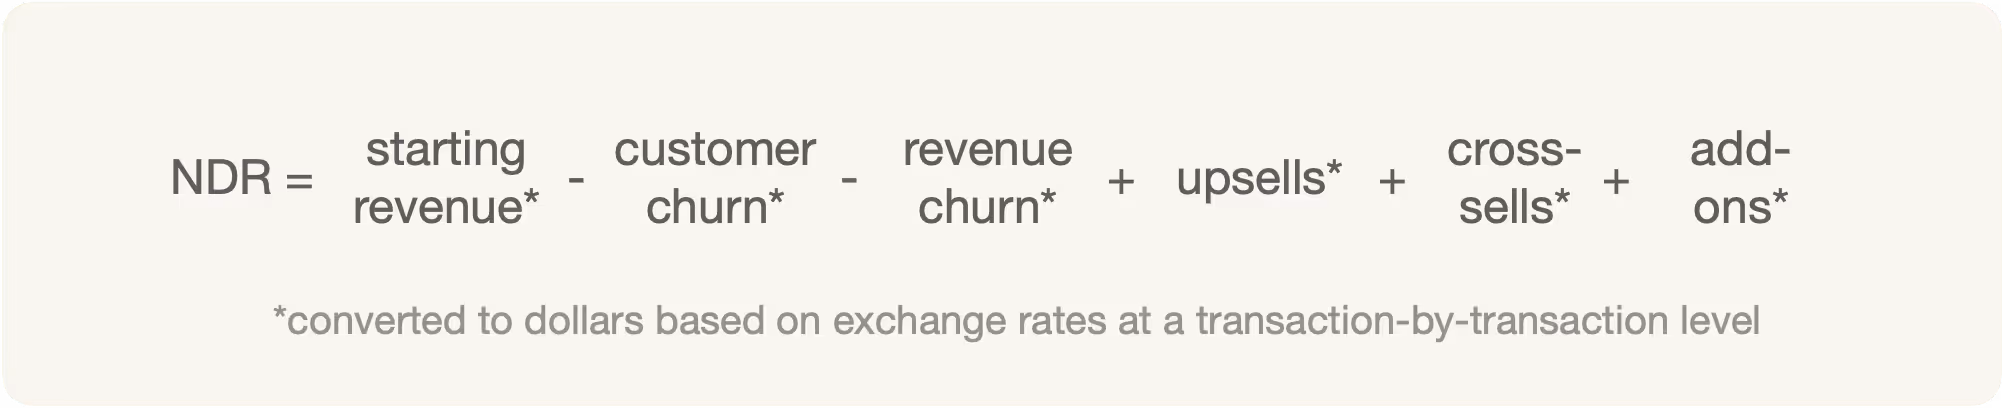
Net Revenue Retention (NRR) is the revenue at the beginning of the period minus all the churn (customer and revenue churn) plus all the expansion revenue (upsells or upgrades, cross-sells, and add-ons) in the period.
NRR in terms of GRR is:
NRR = GRR + expansion revenue in period.
Continuing with our example, if the revenue at the end of June was $4M, customer churn in July was $300K, revenue churn was $200K, and upsells, cross-sells, and add-ons were $600K, $300K, and $100K respectively,
NRR = $4M - $300K - $200K + $600K + $300K + $100K = $4.5M.
What is Net Revenue Retention Rate?
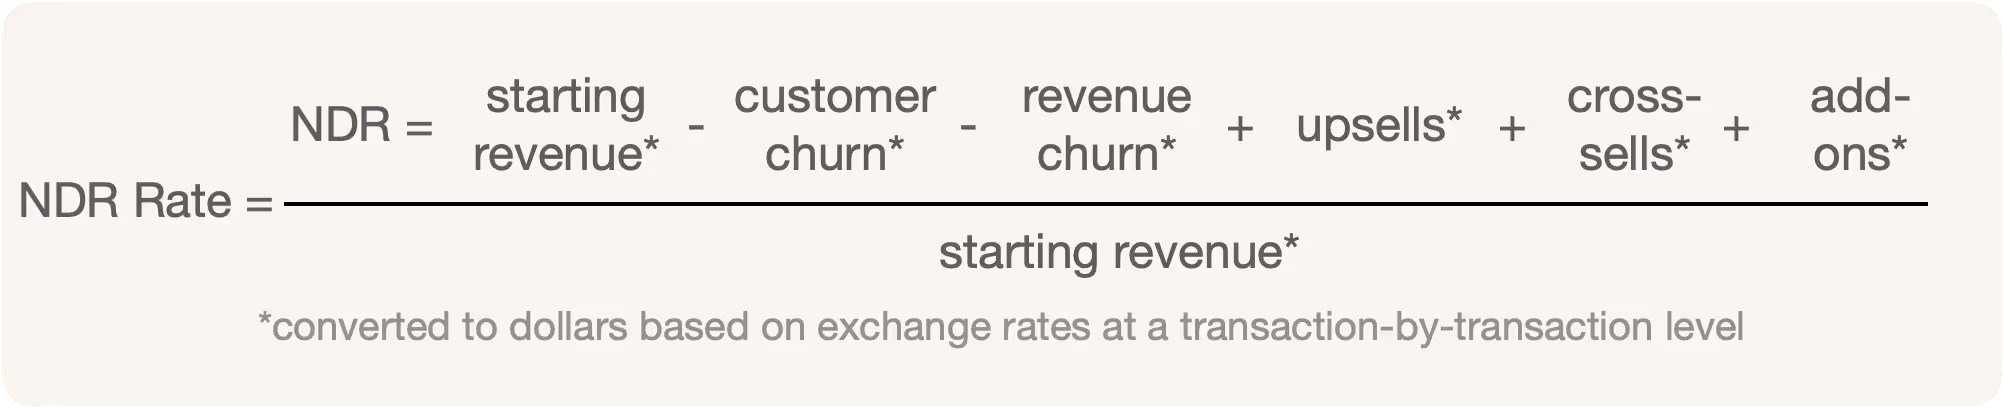
Net Revenue Retention Rate is the revenue at the beginning of the period minus the customer and revenue churn plus the upsells or upgrades, cross-sells, and add-ons at the end of the period divided by the beginning revenue.

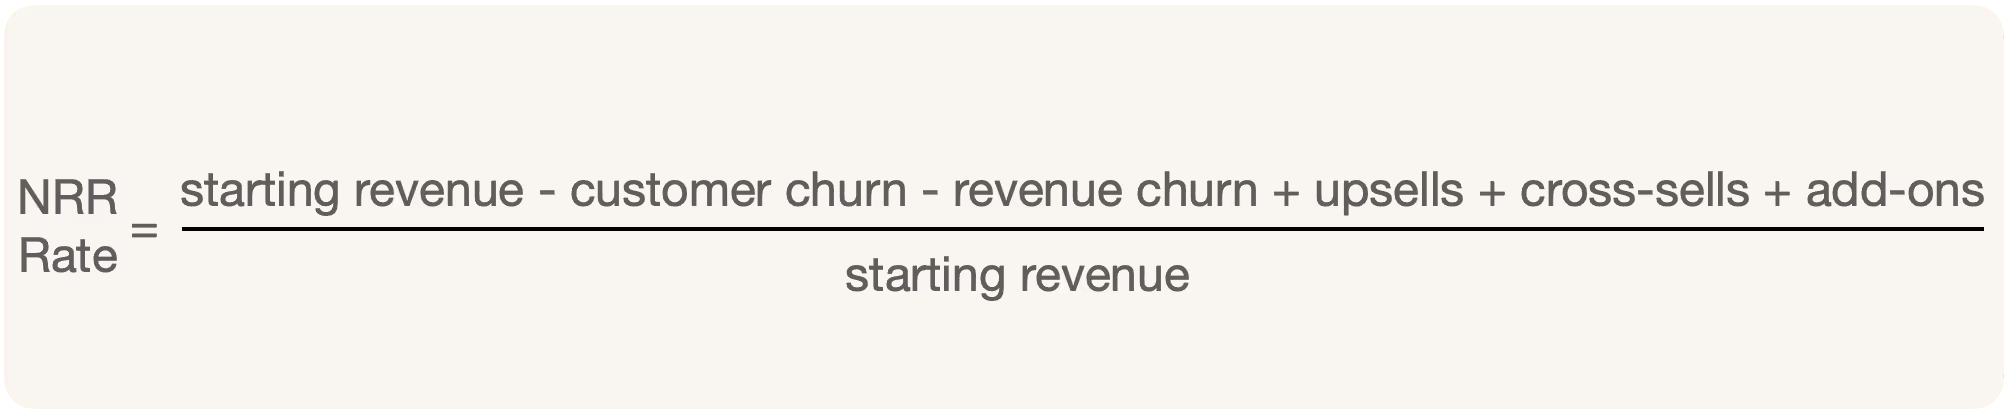
NRR Rate = (GRR + upsells + cross-sells + add-ons) / starting revenue
Continuing with our example, if the revenue at the end of June was $4M, customer churn in July was $300K, revenue churn was $200K, and upsells, cross-sells, and add-ons were $600K, $300K, and $100K respectively,
NRR Rate = ($4M - $300K - $200K + $600K + $300K + $100K)/$4M = 112.5 % or 1.125
Is NRR a ratio or a dollar value?
Technically, NRR is a dollar value and NRR rate a ratio or a percentage. However, similar to GRR Rate, NRR Rate is often just abbreviated as NRR. When represented as a ratio or percentage, it is the rate versus a dollar value.
NRR expressed as a ratio or percent, i.e., 1.125 or 112.5% is a rate, and NRR expressed as a dollar value, i.e., $4.5M is NRR.
What is Net Dollar Retention?
Net Dollar Retention (NDR) is the starting revenue in dollars at the beginning of the period, minus the customer and revenue churn in dollars, plus the upsells or upgrades, cross-sells, and add-ons in dollars. It is essential to highlight that revenue, churn, and expansion are converted into US dollars to accommodate currency translation and exchange rate fluctuations. That is how NDR differs from NRR.
For Customer Success and a SaaS metric to measure and track, Net Dollar Retention (NDR) is the same as Net Revenue Retention (NRR). However, your book-keeping professional obviously will have a different opinion.
For Customer Success Net Dollar Retention (NDR) is the same as Net Revenue Retention (NRR). Your book-keeping professional obviously will have a different opinion.
NRR Rate = NRR / starting revenue (all converted to dollars)
To further illustrate the point, if the revenue at the end of June was $4M, customer churn in July was $300K, revenue churn was $200K, and expansion reveue was as follows:
- upsell of £217.38 with pound to dollar exchange rate of 1.38
- upsell of $100K
- upsell of ¥11,111K with Yen to Dollar conversion rate of 1/111
- upsell of £71K with pound to dollar exchange rate of 1.41
- cross-sell of $300K
- add-on of $100K
NDR = $4M - $300K - $200K + (217.38K x 1.38 + 100K + 11,111K / 111 + 71K x 1.41) + $300K + $100K
NDR = $4,500,193
NDR rate = 112.5048%
Who watches which metric? (CFO vs. CRO)
While the terms are often used interchangeably, the nuance matters to your executive team:
- The CRO (Chief Revenue Officer) prioritizes NRR. It shows the overall health of the customer relationship and the success of the expansion/sales team, regardless of currency headwinds.
- The CFO (Chief Financial Officer) prioritizes NDR. They must report "Realized Revenue" to investors. A Global CFO prefers NDR because it accounts for daily currency fluctuations and conversion rates that affect the actual cash in the bank.
Constant Currency NDR
NDR may use a fixed exchange rate in certain cases to remove the impact of foreign currency translations. It is then differentiated as Constant Currency Dollar-Based NRR or Constant Currency NDR or Constant Currency Dollar-Based Net Expansion Rate (e.g. Agora.io S-1).
In the above example using a constant currency rate of 1.4 for pound to dollar,
Contant Currency NDR = $4M - $300K - $200K + (217.38K x 1.4 + 100K + 11,111K / 111 + 71K x 1.4) + $300K + $100K
Contant Currency NDR = $4,508,831
Contant Currency NDR rate = $4,508,831 / $4M = 112.72%
NRR and NPS
NRR has become so popular that even NPS wants to associate itself with NRR.
The best thing about NPS (and many argue, the only good thing) was finding references at scale. Promoters, i.e., customers that rated your product a 9 or a 10 score for likelihood to recommend, may be asked for reviews on G2 and referrals to other customers.
In a 2022 book, the creator of NPS defines Earned Growth Rate as a function of NRR and revenue from referrals.
What is Earned Growth Rate (EGR)? (NPS 3.0)
Earned Growth Rate is the sum of Net Revenue Retention, the percentage of revenue from customers who were referred versus total revenue, and minus 100.
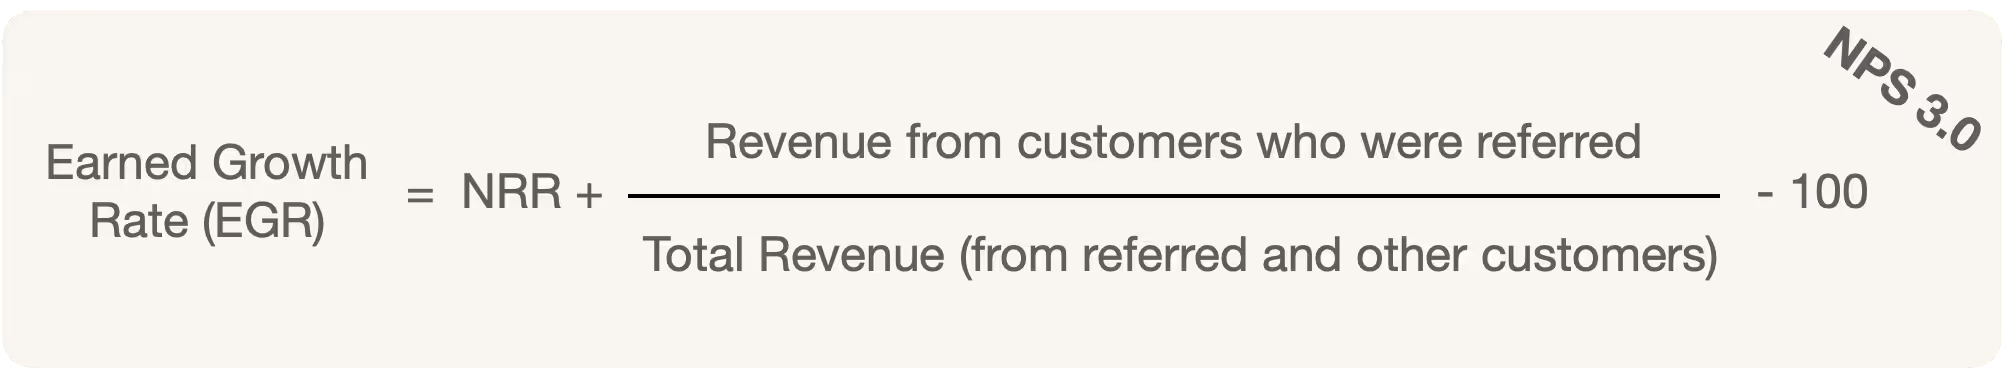
EGR = NRR + ENC - 100%,
where ENC (Earned New Customers) = 100 * ratio of revenue from new customers who were referred and sum of revenue from new customers who were referred and not referred.
NRR and NDR - a deeper dive
How GRR and NRR differ from a business's perspective
When looking at different metrics to measure a business's profitability, the GRR is an important metric. This is because it accounts for recurring revenue from existing customers and includes downgrades and cancellations.
So, how does the GRR differ from the NRR?
First, GRR does not consider upgrades and cross-sells which support a company's expansion.
Second, the GRR shows how well a business can retain revenues from its customers.
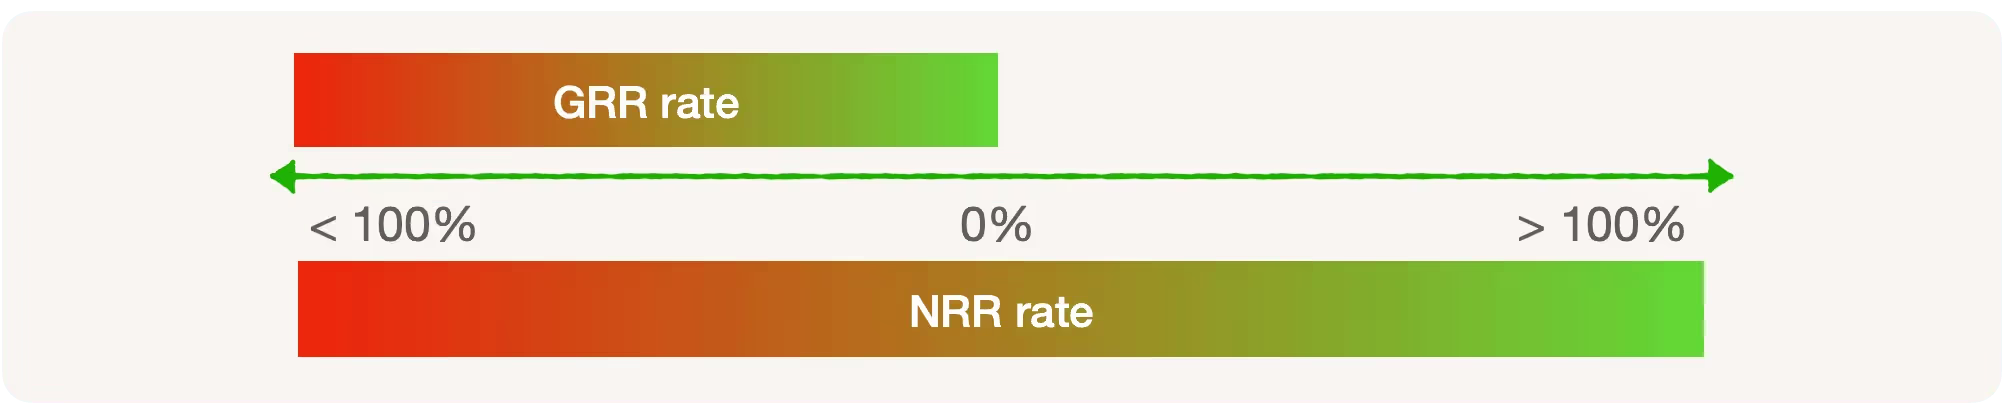
GRR can be equal to or lower than the NRR. However, it is always less than 100%.
The NRR could be less than 100%, equal to 100%, or more than 100%. NRR rate more than 100% is a sign of growth.
GRR as close to 100% is a sign of revenue retention.
NRR rate more than 100% is a sign of growth.
- GRR <= 100%
- GRR <= NRR
- NRR for a growing company > 100%
GRR shows the amount which could have been made through a company's existing customers. Therefore, this metric helps to measure a business's growth in the long run. The NRR, instead, gives a more realistic picture of the growth a company can expect from its customer base.
For investors, the GRR is essential when it comes to measuring the health of a SaaS company. A low GRR indicates that a company cannot retain its customers and is not feasible in the long run. However, since the NRR shows the possible profit it can make from its existing customers, this metric should not be neglected.
So, are NRR and NDR better growth metrics versus the LTV/CAC ratio?
Yes.
The NRR can give insight into how sticky a company's customers are. It provides information about how long customers use a business service. Furthermore, it takes a company's value proposition into account and how satisfied the customers are. The latter significantly impacts whether customers decide to stay with one SaaS company or switch to another provider.
- NDR provides information about the value that a company's customers have over time with the same company. By accounting for this, the NDR shows the growth of the business.
- The NRR does not have several churn model problems.
- It does not have a churn in the denominator, so no unreasonable LTV approaching infinity.
- Negative Churn does not break the model.
- It focuses on growth by expansion versus acquisition. As a result, it is not vulnerable to timing.
- Product-led companies can have low unit acquisition costs, and that is why they can serve several customers.
- NRR is not subject to easy manipulation, and public companies are comfortable reporting it or its variation. Public companies tend to define what they mean by NRR or why they, for instance, exclude customers that spend less than a specific dollar amount per month.
- NRR is a clear indicator of any negative and positive impacts on the business due to customer retention and revenue expansion.
The NRR Compounding effect
The combination of recurring revenue and negative churn leads to a compounding effect.
Both David Skok and Tom Tunguz explain the compounding effect well using Negative Churn.
- See section "The Power of Negative Churn" here.
- See "Why Negative Churn is Such a Powerful Growth Mechanism" here.
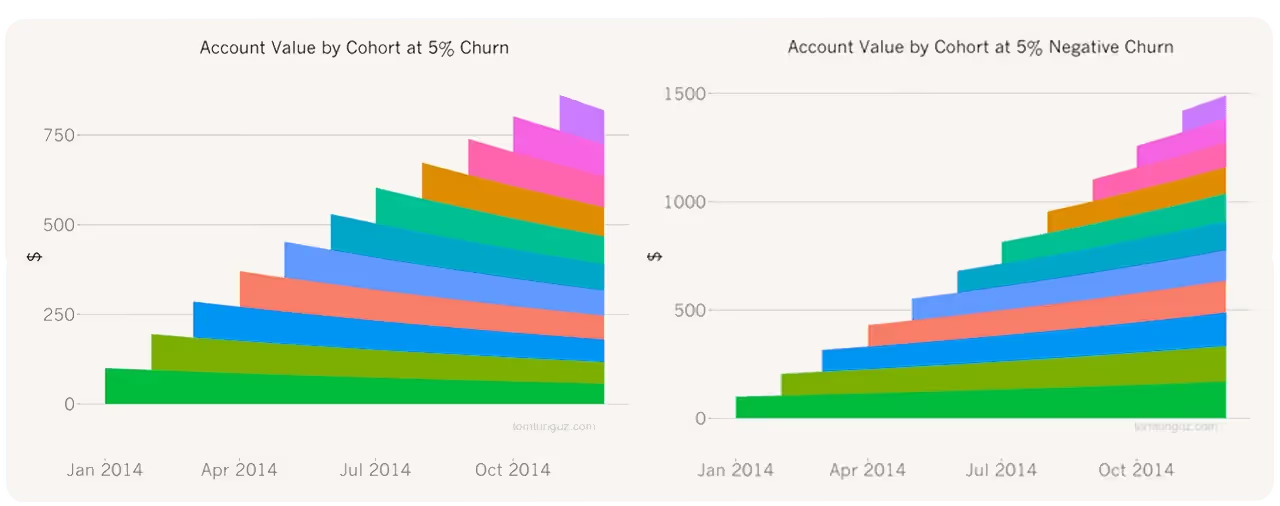
Tom takes a hypothetical SaaS startup that acquires 100 customers per month, each paying $1 per month to use the product. And the company loses 5% of those customers each month (i.e., 20-month lifetime span), so in 10 months, half of the cohort has churned.
If the remaining 95% of the customers grow their spend with the startup by 10%, the total revenue per cohort is 105% of the revenue from the previous month.
NRR and it's variations
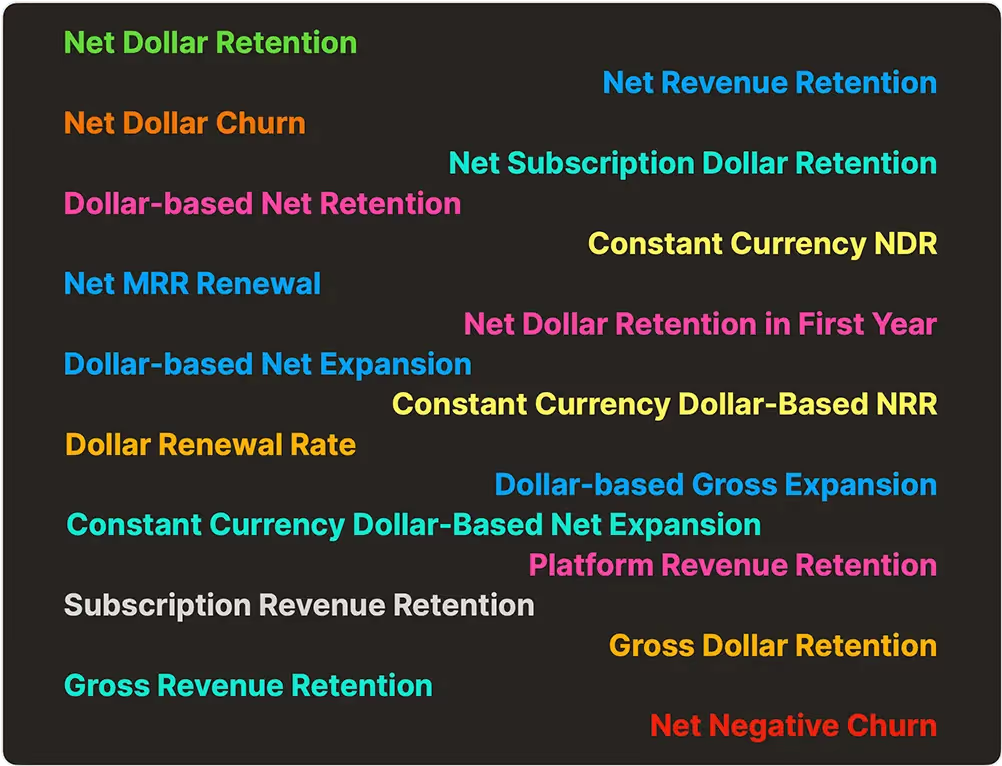
The NDR has several variants. Scanning SEC S-1 documents and other company disclosures, I found several variations that are very closely linked.
- Net Dollar Retention (NDR)
- Net Revenue Retention (NRR)
- Net Retention Rate (NRR)
- Net MRR Renewal
- Net Negative Churn
- Net Dollar Retention in First Year (source)
- Dollar-based Net Retention Rate – see WalkMe IPO S-1 below
- Dollar-based Net Expansion Rate – see Twilio S1 and Agora.io IPO S-1 below
- Constant Currency Dollar-Based NRR
- Constant Currency NDR
- Constant Currency Dollar-Based Net Expansion Rate (e.g. Agora.io S-1 below)
- Dollar Renewal Rate (DRR) - David Skok SaaS definitions
- Platform Revenue Retention Rate (PRRR) – 2U S-1
- Subscription Revenue Retention Rate
- Net Subscription Dollar Retention Rate – Appian S-1
The NRR is not a GAAP-compliant accounting metric. Companies use variations in names to match what they measure and differentiate from standard definitions.
If you look at various S-1 SEC filings, every company defines the metric they use. Public companies are fortunately required by SEC to provide clear definitions of any non-GAAP compliant metrics they use.
NRR like metrics in S-1 Statements: Twilio, WalkMe, Snowflake, Agora, and 2U
S-1 statements are filed by a company registering to go public and have a wealth of information for investors and researchers. We are looking at S-1s to get an idea of various NDR variations and see what numbers the companies have reported.
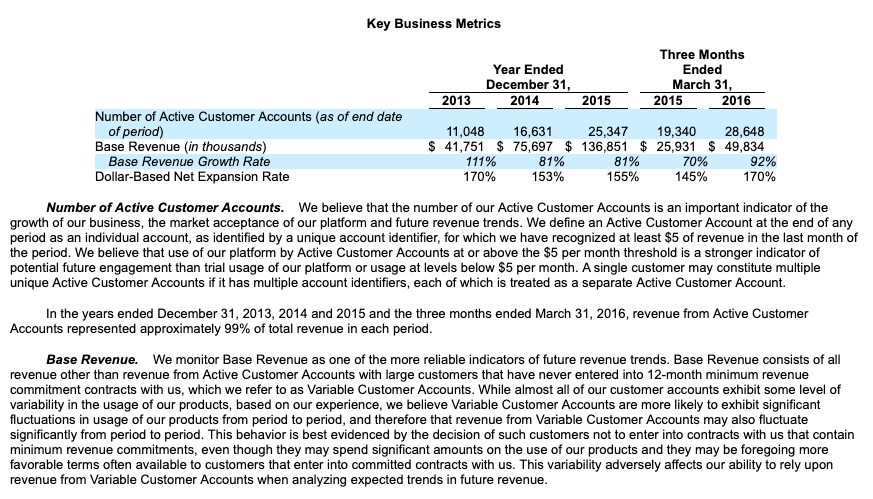
Twilio S-1: Dollar-Based Net Expansion Rate
Twilio uses the term Dollar-Based Net Expansion Rate but limits the definition to the Active Customer Accounts only. Source: Twilio S-1 page 14.
Twilio uses the term Dollar-Based Net Expansion Rate but limits the definition to the Active Customer Accounts segment only, i.e., those who spend at least $5/mo.
Note the metric ranges from 145%-170%. We will see what a good number is below.
Walk me S-1: Dollar-based Net Retention Rate by Segment
Walk me – page 12 uses Dollar-based Net Retention Rate. Note it provides the numbers for all customers and for customers with 500 or more employee segment.
Source: Walk Me S-1, page 12
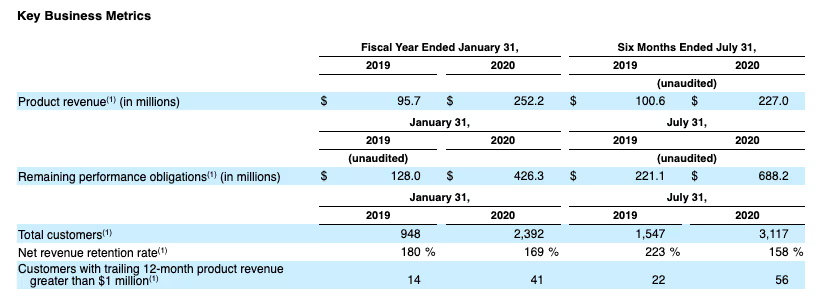
Snowflake S-1: Net Revenue Retention rate
Snowflake uses Net Revenue Retention rate. They monitor the dollar-based net revenue retention rate to measure this growth from exiting customers.
Source: Snowflake S1, page 11
The NRR number of 223% in the 6-month ending 2019 is one of the highest reported in the industry.
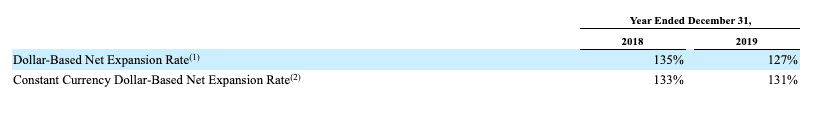
Agora S-1: [Constant Currency] Dollar-Based Net Expansion Rate
Agora is an international company and uses both Dollar-Based Net Expansion Rate and Constant Currency Dollar-Based Net Expansion Rate. They define an active customer as a customer that paid more than $100 in the preceding 12 months.
Source: Agora S-1 page 17-18
- The Dollar-Based Net Expansion Rate measures the ability to increase revenue generated from the existing customer base.
- The Constant Currency Dollar-Based Net Expansion Rate is calculated the same way as Dollar-Based Net Expansion Rate but using fixed exchange rates based on the daily average exchange rates prevailing during the prior year to remove the impact of foreign currency translations.
- Constant Currency Dollar-Based Net Expansion Rate facilitates operating performance comparisons on a period-to-period basis.
2U S-1: Platform Revenue Retention rate
2U brings colleges and universities to higher education online. In their 2014 S-1 filing they reported annual Platform Revenue Retention rate ranging from 127% to 157%.
Source: 2U S-1 pages 51-52

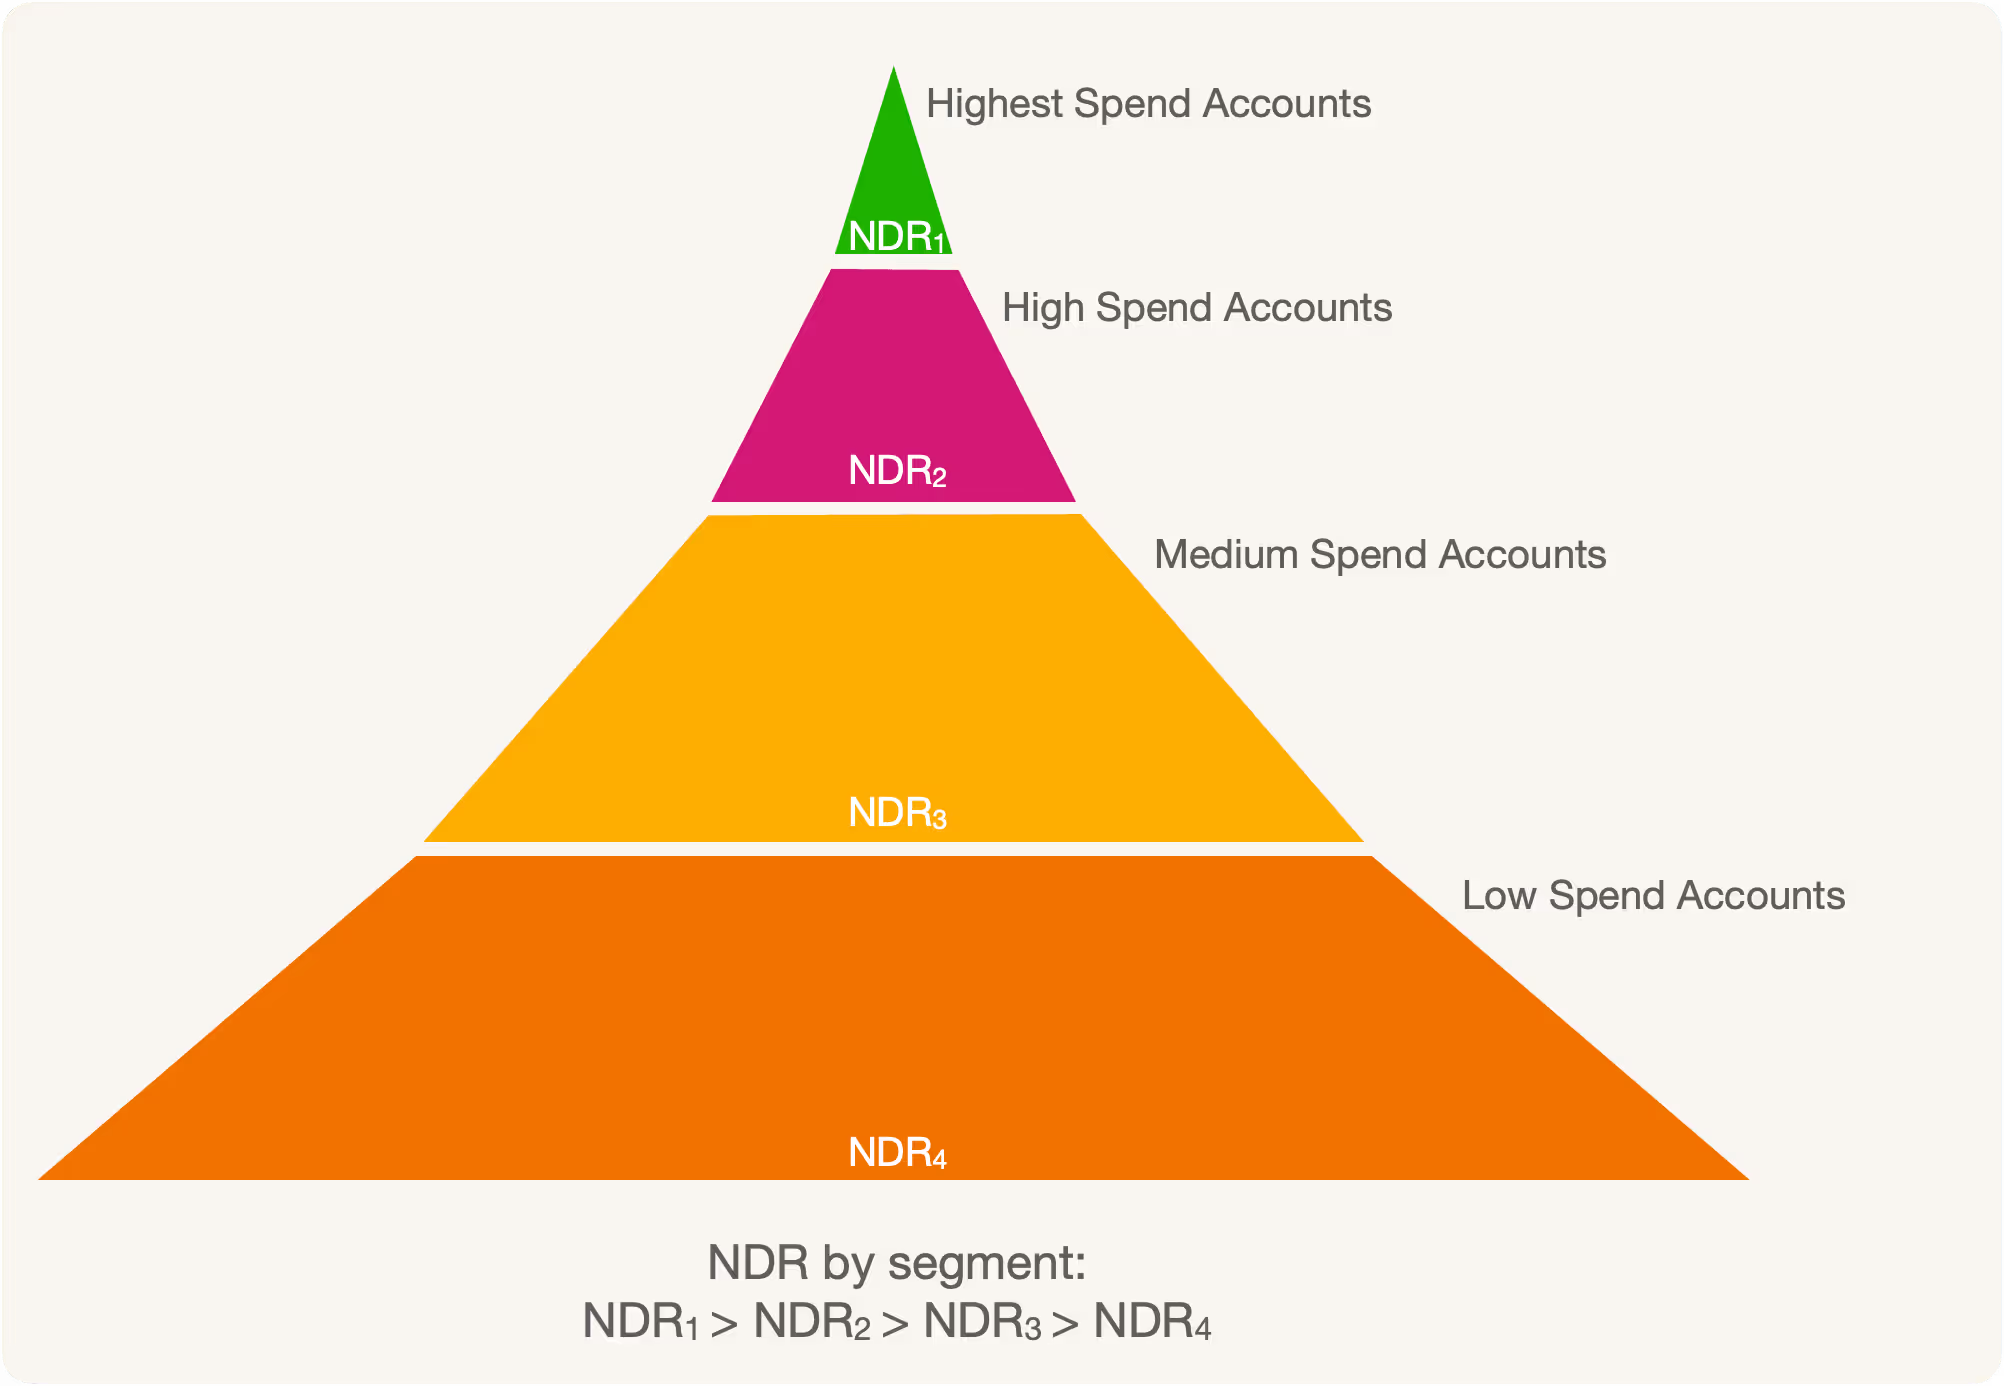
NRR and customer account segments
Although the NRR is reported for the entire company, it is essential to track it by segments internally within the company.
The largest customers behave differently from the smallest customers. The effect of an individual segment — for example, the long-tail accounts on a business — can be hidden in aggregate data, and its sense of impact lost.
With internationalization becoming a norm, I am going to use NDR for this section.
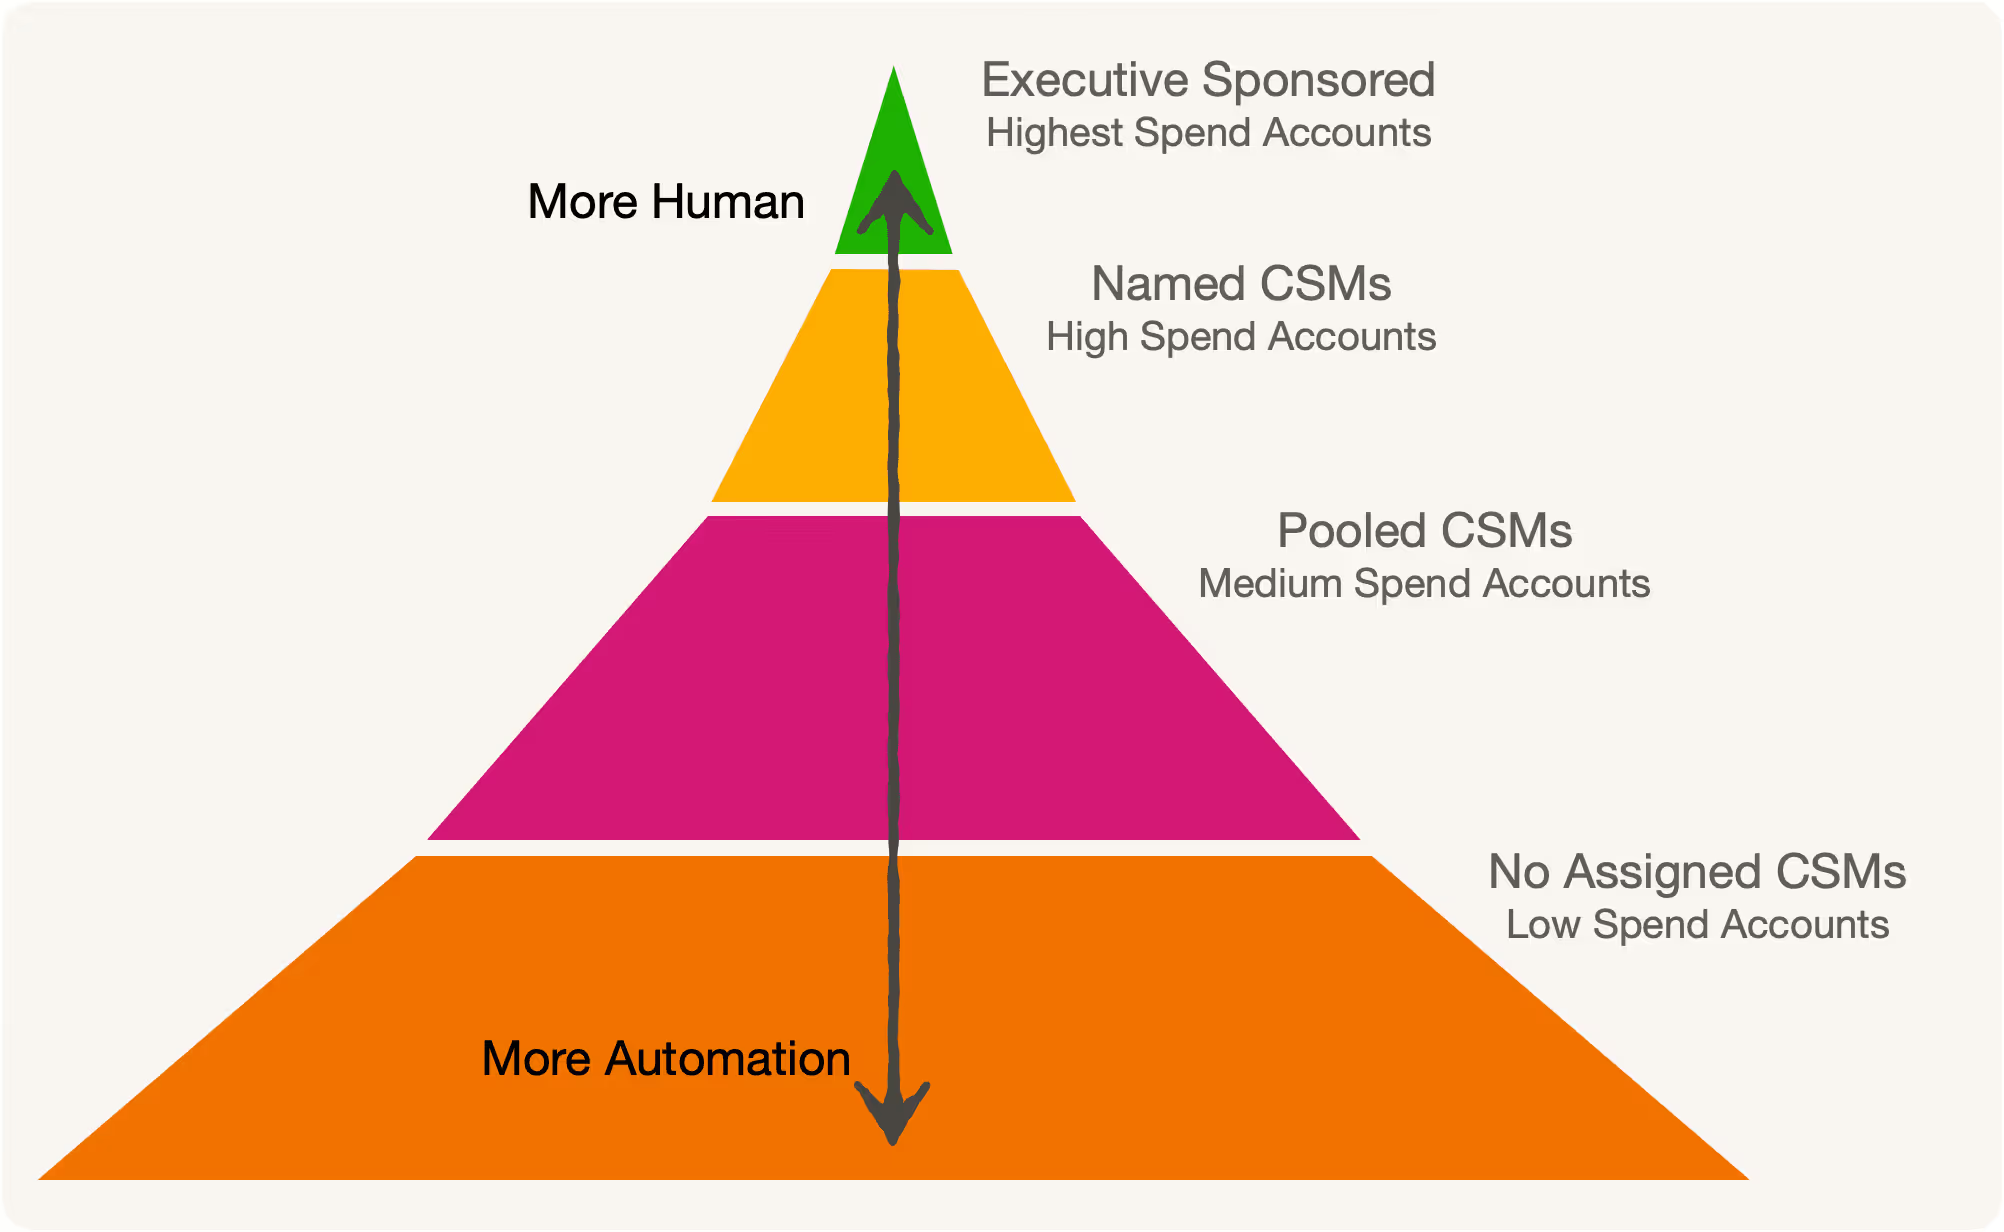
CSM-managed accounts have lower churn, higher renewals, better up-sells, cross-sells, and add-ons than lower-paying long-tail of CSM unmanaged accounts. For CSM unmanaged accounts, churn rates are high, renewals are lower, and expansion is almost non-existent.
A company may make 32% revenue from the top 5% of the CSM-managed customer accounts, implying 68% of revenue comes from several lower-paying CSM-unmanaged customer accounts.
Measuring the components that makeup NRR separately makes sense for driving the right metric.
Even in CSM-managed accounts, we tend to give more attention to higher paying or strategic accounts at the expense of the smaller accounts in the same segment. I like to explain this as micro-CSM-pyramids, or pyramids with a segment.
Based on some discovery interviews, here is how some companies are dividing up growth strategies for various segments. I'll add more here as I get approvals to share more.
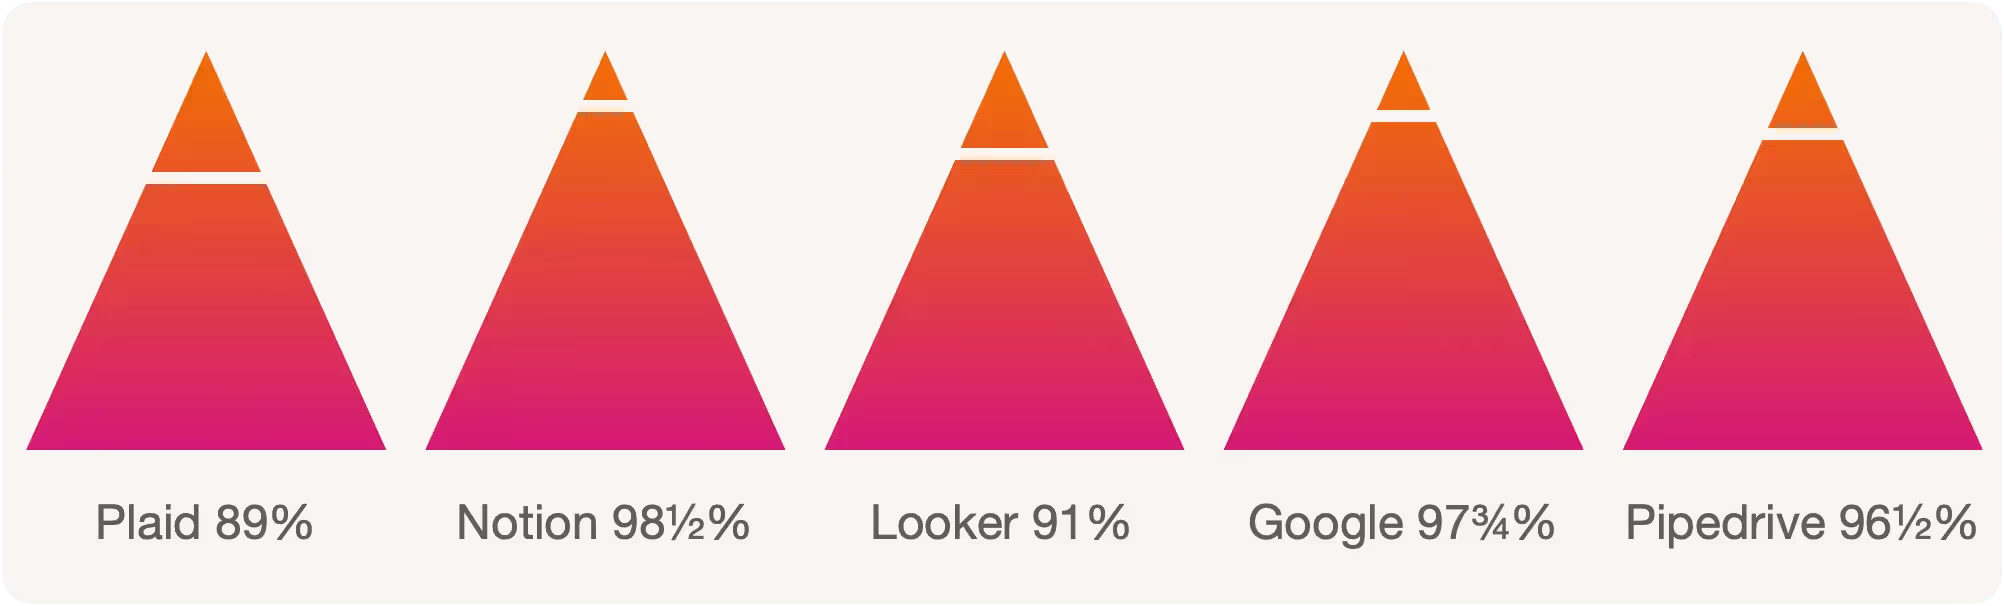
- Plaid - 11% named CSMs (Customer growth managers), 89% automation
- Notion - 1½% named CSMs, 98½% automation
- Looker - 9% named CSMs, 91% automation
- Google Cloud - 2¼% named CSMs, 97¾% automation
- Pipedrive - 3½% named CSMs, 96½% automation.
68% revenue comes from lower segments adding up to 96½%
NRR for long-tail Customer Success
The NRR is a widely used metric to indicate customer success. The metric is even more effective for measuring customer success for long-tail accounts. Since unlike the CSM-managed customer accounts, no one is paying much attention to the long tail. As shown above,
Retaining long-tail customers is crucial for B2C and B2B SaaS businesses. The Net Retention Rate for the long-tail accounts provides information about a company's ability to generate recurring sales from its low-paying but high-volume customers.
Retaining customers in B2B SaaS is 6.4 times cheaper than acquiring new customers. For B2C, the number varies by industry, and it is 5 to 25 times cheaper than acquiring new customers. (Bain Research)
Small changes in Net Revenue Retention can significantly impact future profits due to the compounding effect. In fintech, for example, a 5% increase in customer retention produces more than a 25% increase in profit. As existing customers buy more from a company over time, operating costs to serve them are lower.
What does a good NDR and GDR rate look like?
The NDR is an indicator of a business's growth rate. Therefore, the NDR rate above 100% indicates that the company can grow. Most importantly, it can continue to grow without acquiring new customers, i.e., the revenue generated from upgrades, upsells, and cross-sells exceeds the revenue lost because of lost customers and downgrades.
NDR rate above 100% indicates that the company can grow
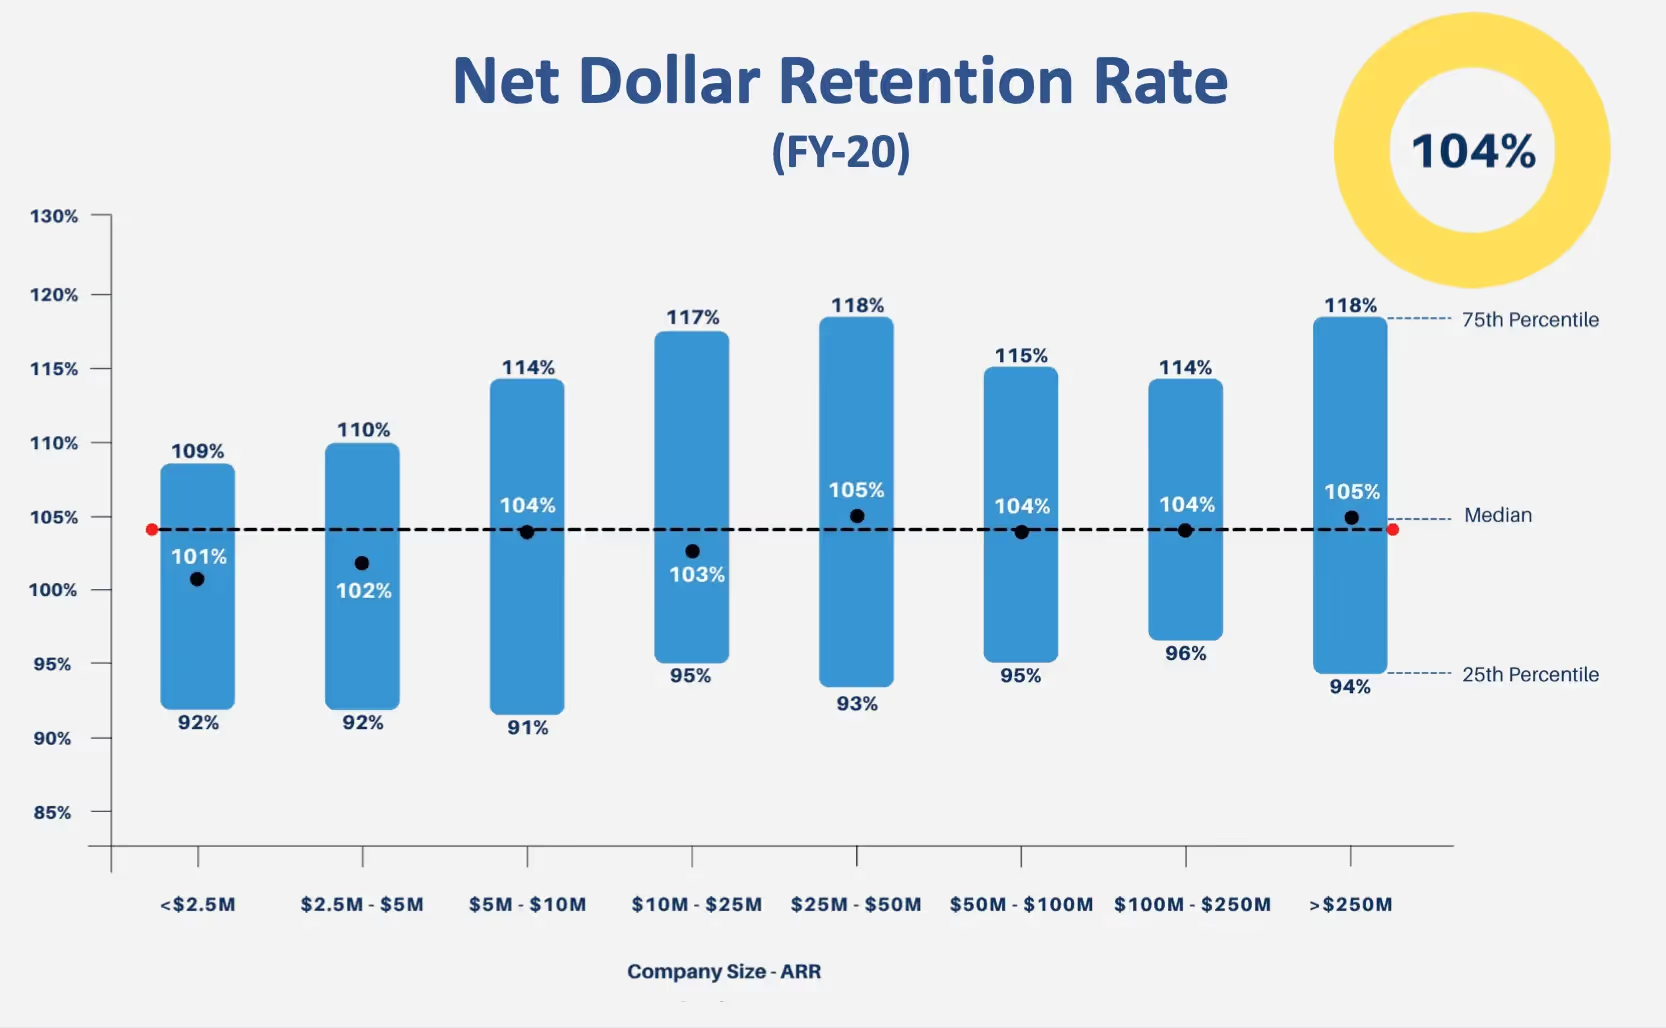
When looking at all SaaS businesses, the average Net Retention Rate is around 100%, with a median of 104%. However, it is essential to differentiate between enterprise SaaS companies and B2B SaaS companies that sell into smaller and medium-sized businesses. For the latter, a Net Dollar Rate above 89% is considered good. On the contrary, Enterprises with an NDR exceeding 125% are considered healthy.
Enterprises with an NDR exceeding 125% are considered healthy.
Snowflake reported dollar-based NRR of 223% in the 6-month ending 2019. See S-1 section above.
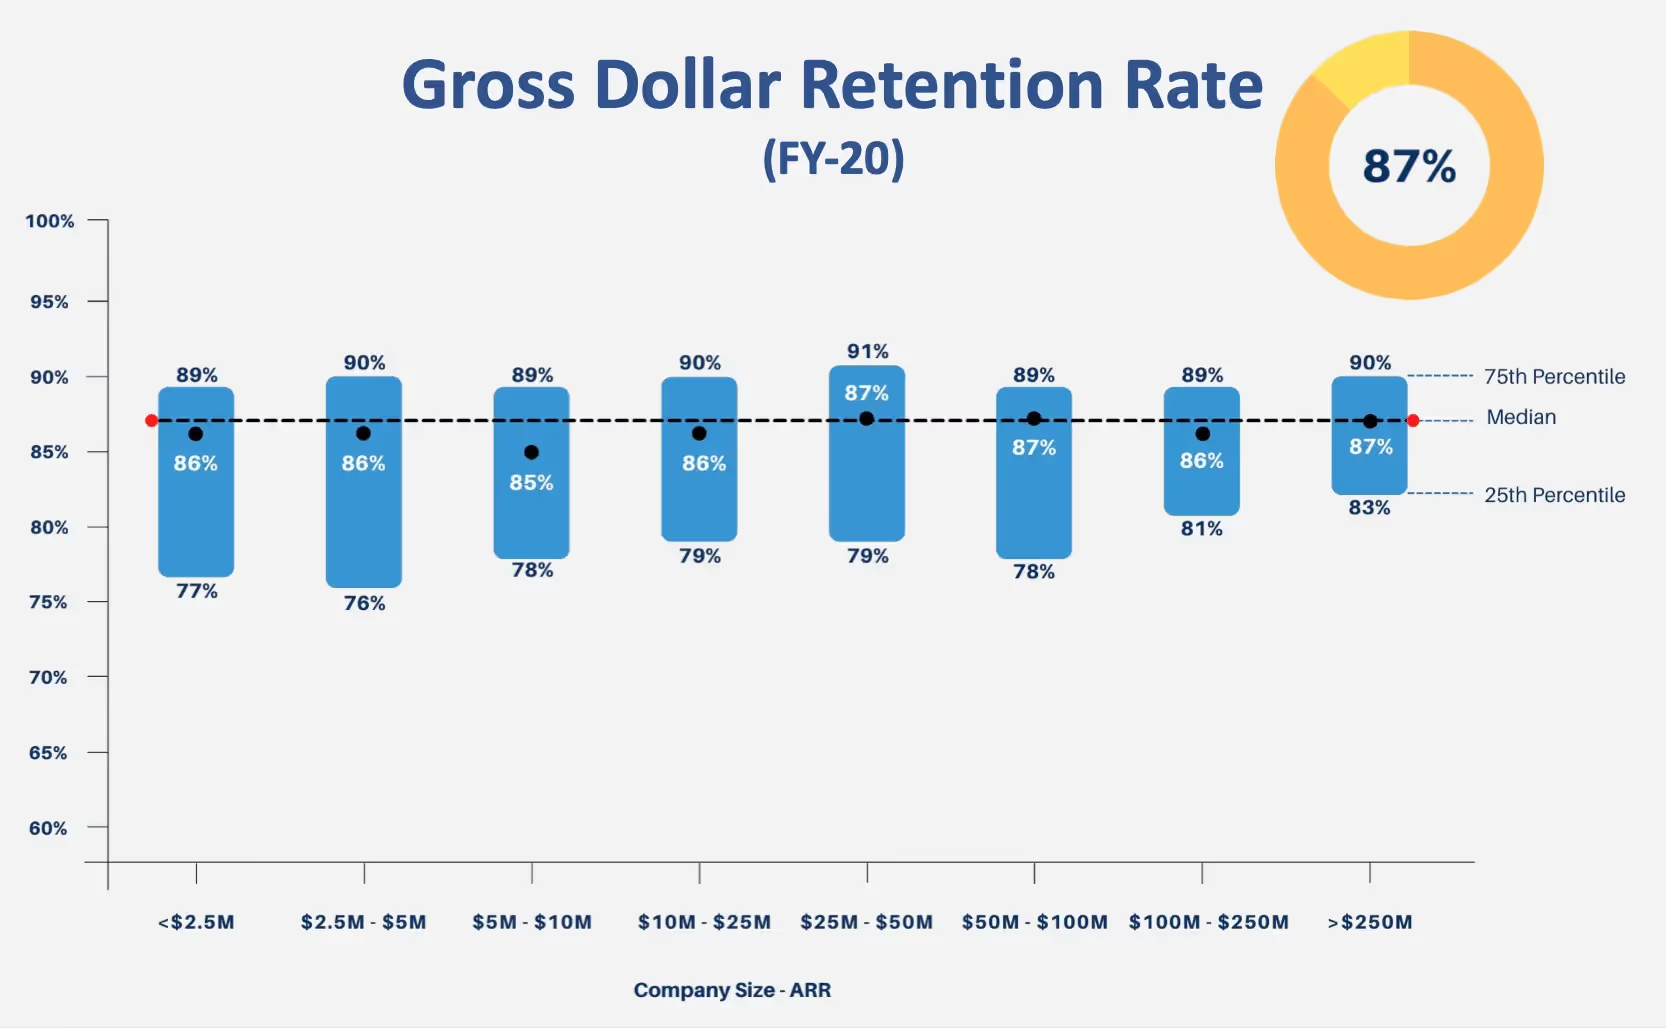
Here is data from RevOps Squared Research for companies with different ARR. The median value for GDR is 87%, and the median value for NDR is 104%.
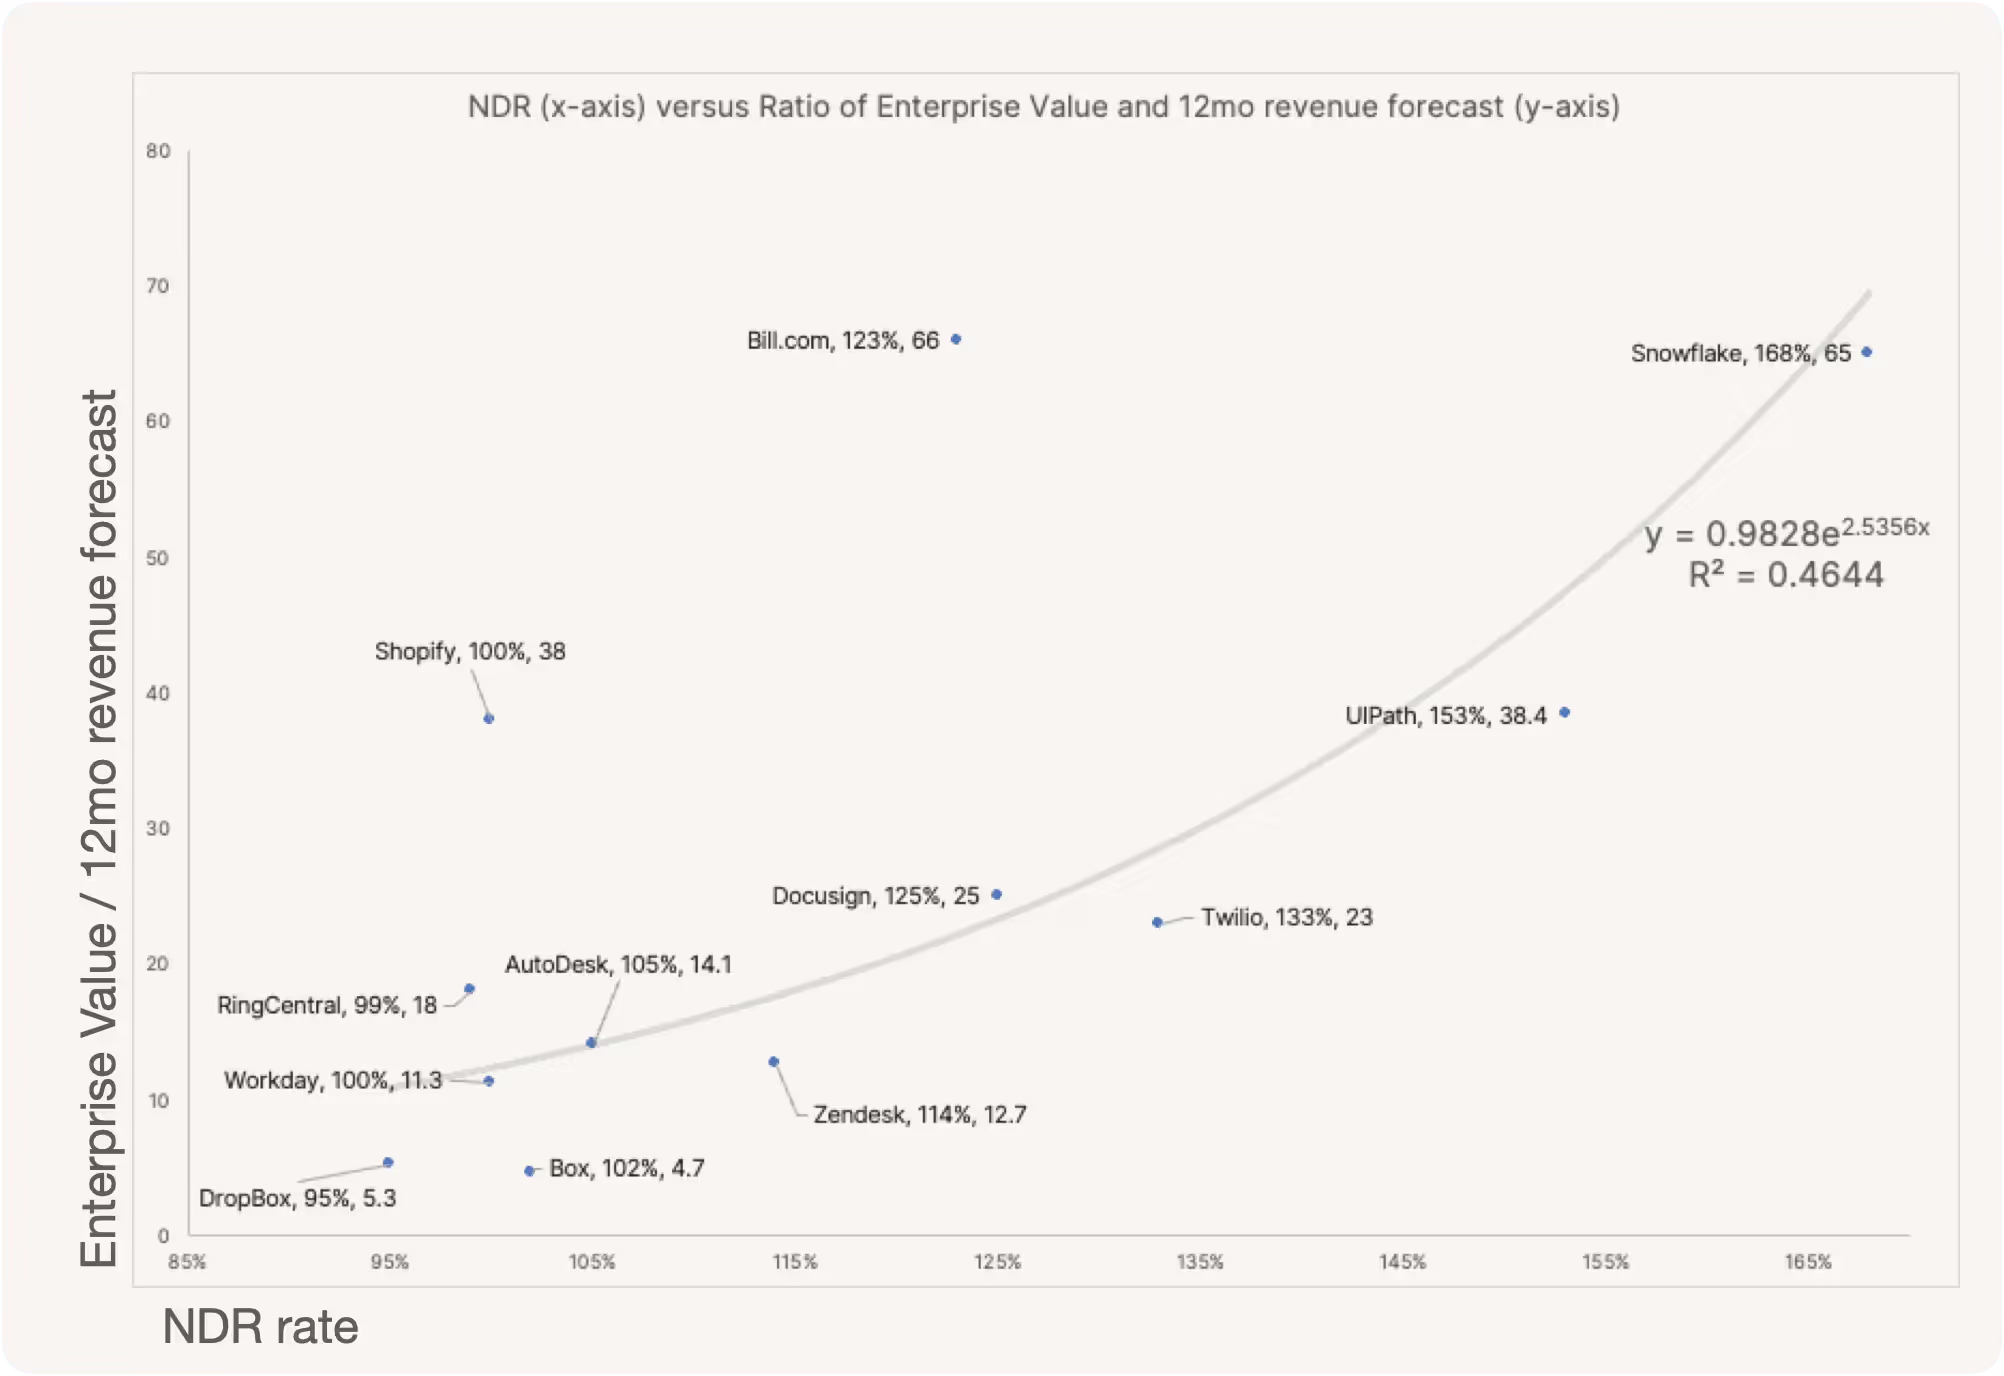
NRR or NDR and Enterprise Value
NRR and NDR are highly correlated to Enterprise Value (EV) and is a key company valuation driver. Typically Enterprise Value is Market capitalization plus short- and long-term debt minus liquid assets.
Here is a selection of companies with
- NDR (x-axis)
- Ratio of Enterprise Value and 12 month forecasted revenue (y-axis)
12 month forecast is also abbreviated as NTM, which means Next 12 Month revenue.
Data source.
Reality Check: The Snowflake Effect
When Snowflake's NRR dropped by 47% — and the CEO exited — many wondered if the NRR drop was one of the reasons. Note, 131% NRR is significant and high, but Snowflake's NRR Rate in FY22 Q4 was an industry-leading 178%.
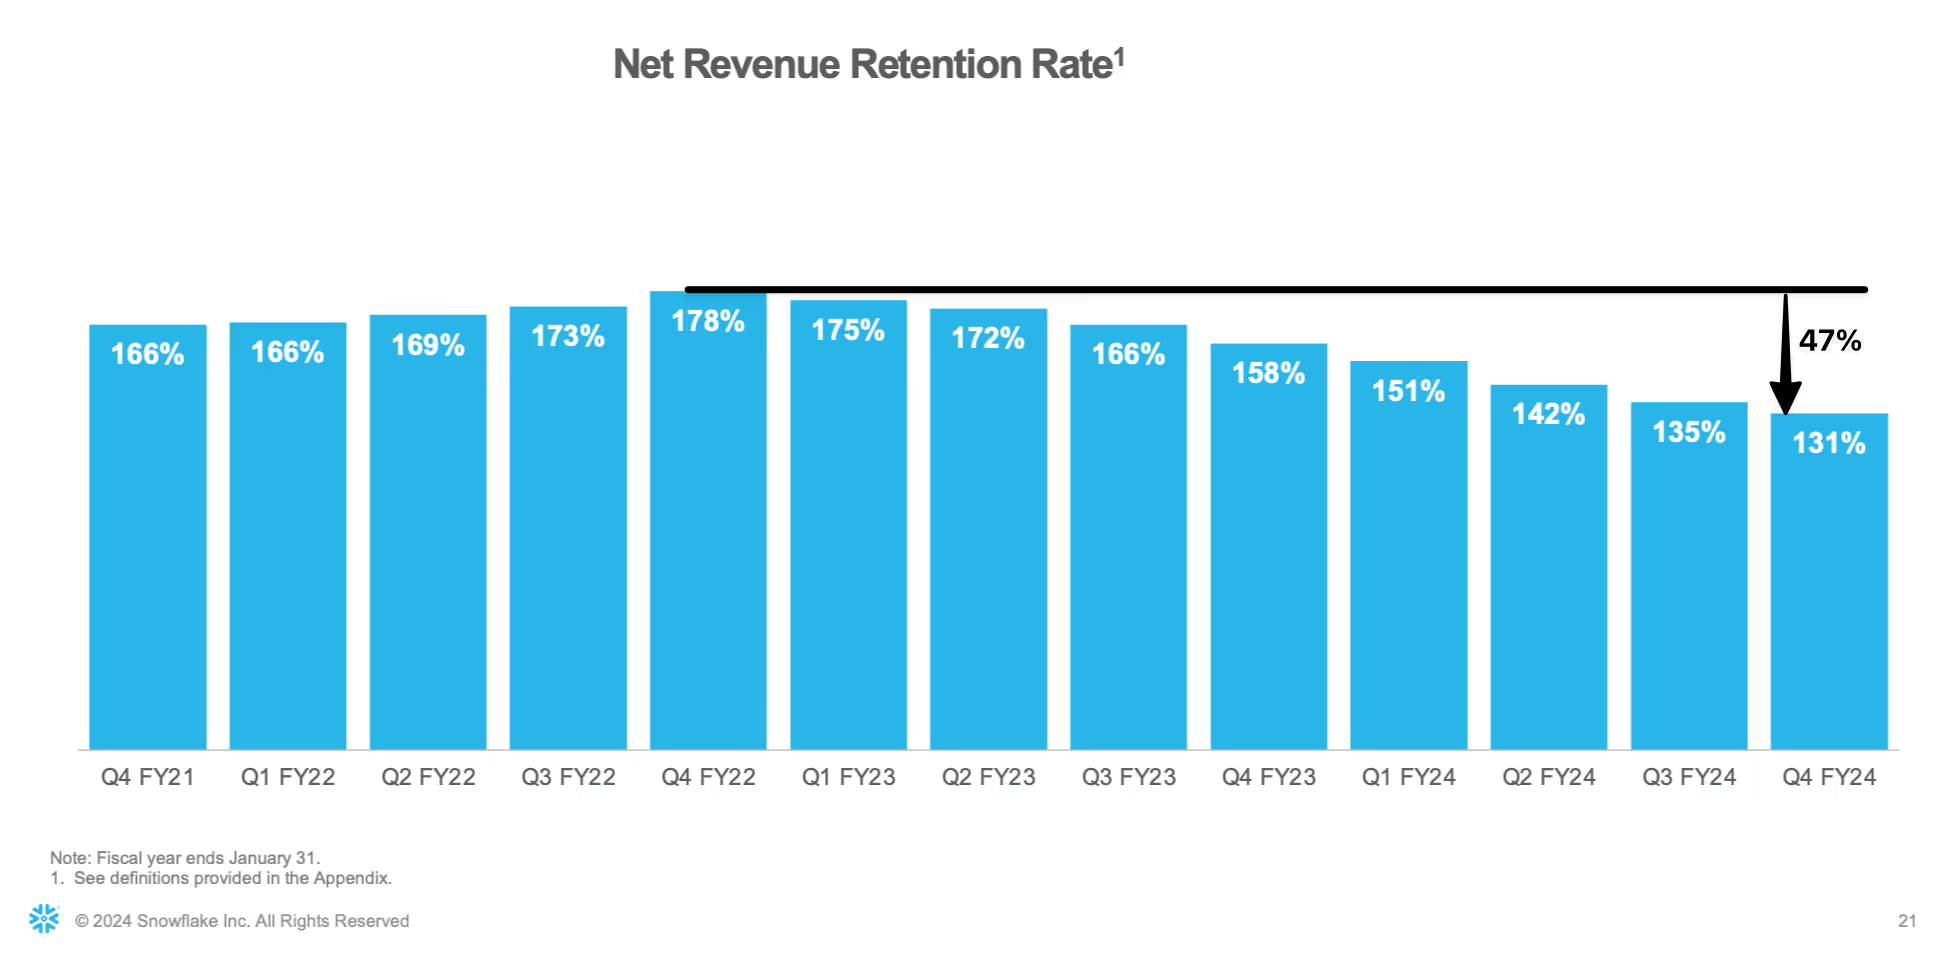
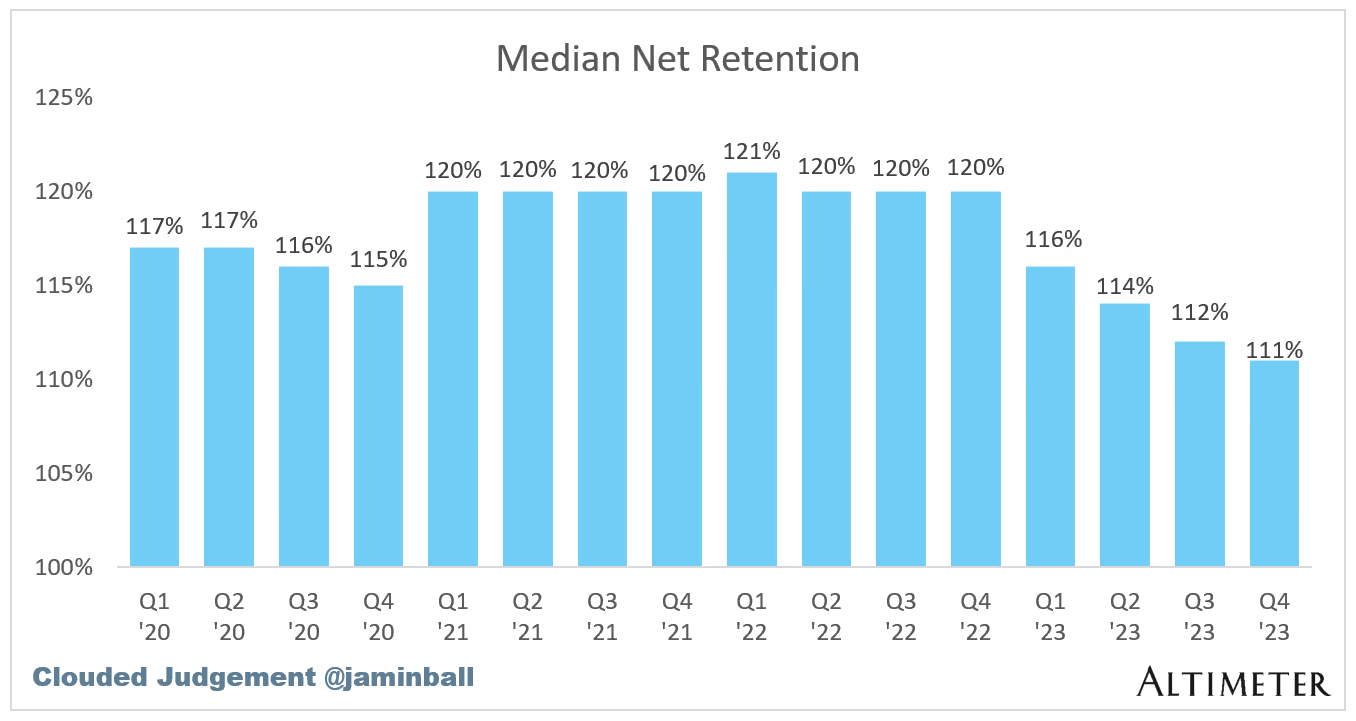
Although, the quarter lower guidance may have been the really reason for the significant market cap drop. Putting th 47% NRR drop in perspective, the median NRR across businesses dropped 10%.
Wall Street correlates your retention directly to your company's value. This proves that NRR is not just a "health" metric for your CS team; it is a valuation metric for your investors. They don't just want to know if you are keeping customers; they want to know if your customers are fueling your growth automatically.
How to grow NRR
SaaS businesses can grow their NRR by minimizing logo and revenue churn and maximizing renewals, up-sells, add-ons, and cross-sells.
Here is a starting list of items that should help grow NRR period-over-period. I'll keep adding to this over time.
- Provide continuous value,
- Proactively look for problems and solve them preemptively to prevent churn,
- Make renewals easier,
- Acquire customers that are best suited to receive value from the product you offer,
- Measure, track, and manage NRR differently for various segments,
- Measure, track, and manage churn, renewals, up-sells, cross-sells, and add-ons for high-paying CSM-managed segments separately from the low-paying long tail of high-volume customer account segments,
- Use the power of viral and network effects to grow customers,
- Inbound marketing,
- Focus on Customer Marketing to drive NRR and Retention Marketing to drive GRR.
- Use the power of community to help customers help each other,
- Offer free or freemium models to find leads from the free users of your product,
- Offer free trials to reduce selling to wrong customer profiles,
- Rely on product-led go-to-market strategies,
- Use of open-source software to reduce costs,
- Employ touchless prospect to customer conversion,
- Use self-service product onboarding,
- Use inside sales,
- Automate marketing,
- Offer scalable pricing,
- Offer recommendation driven upsells and cross-sells,
- Automate sales and renewals,
- Automate CS functions,
- Offer Digital CS at least to lower-paying segments.
- Offer virtual CSMs for long-tail,
- Hire Digital CSMs, CS Ops, Customer Ops, or Post-sales Ops
- Increasing recurring revenue,
- Reduce churn proactively,
- Reduce reliance on costly field sales,
- Reduce outbound marketing and high marketing costs,
- Increase customer satisfaction,
- Decrease the difference between perceived and delivered value,
- Share value continuously with executive buyers, campions, and users at a cadence of their choice.
Everything in a nutshell
NRR accounts for the recurring revenue, renewals, cancellations, customer churn, revenue churn, upsells, cross-sells, and add-ons.
It is not subject to problems with metrics based on LTV and CAC.
It is an accepted way to report on growth in S-1 filings period-over-period.
NDR and dollar-based NRR are becoming popular over NRR because NDR provides a more accurate picture by accommodating currency translation and exchange rate fluctuations for companies that sell in several geographies.
For practical purposes, Customer Success and Post Sales teams can assume NDR is the same as NRR.
References
- The cost of acquiring customers has increased by over 60% in the last five years - Profitwell
- Customer willingness to pay for features has dropped by over 30% - Profitwell
- Lennys Newsletter - What is good retention (attitudinal data)
- Gainsight Pulse - Dave Kellogg's slides on NDR
- David Skok - SaaS Metrics
- David Skok - SaaS Metrics 2
- David Skok - SaaS Metrics Definitions
- David Skok - SaaS Metrics 2 Definitions
- Dave Kellog - The cost of Customer Success in CAC
- HBR - value of keeping the right customers
- Bain Research - Cutting costs (PDF)
- Jason Lemkin - SaaStr: What are Some Tricks Software Companies Use to Manipulate Churn Metrics?
- Tom Tunguz - Churn Fallacies
- David Skok – Is your SaaS system viable?
- Dave Kellog - Gainsight Pulse Slide 7
- Wayne McCulloch - Seven Pillars of Customer Success
- David Skok - The Power of Negative Churn
- Tom Tunguz - Why Negative Churn is Such a Powerful Growth Mechanism
- Seth points out some companies limit the NDR reporting period to the first 12 months of a customer and NRR to a rolling 12-month period.
- SaaS Public Company Reporting Metrics
- GRR and NRR median data from RevOps Squared for different size companies PDF
- Flaw in CLV (dated HBR article)
- Twilio S-1
- Walk Me S-1
- Snowflake S1
- Agora S-1
- 2U S-1
- Meritech capital — Enterprise Value vs. NTM
What is Cast?
Cast scales Customer Success and revenue using automation. Cast generates data-driven content that is explained and presented by a Virtual CSM bot.